Banks Battered As Yield Curve Continues To Flatten
As the turmoil in the stock market drags on, some sectors have been punished worse than others. Bank stocks, specifically regional banks stocks, have been near the bottom of the pack as a flattening yield curve spooks financial investors.
The SPDR Regional Bank ETF (KRE) has fallen more than 14% year-to-date and has experienced a peak-to-trough decline of more than 23%, firmly in bear market territory.
KRE Declining:
Source: Bloomberg
As the yield curve flattens, or the gap between short-term interest rates and long-term interest rates narrows, investors are starting to worry about lending margins compressing. Regional banks have declined more than large money center banks because larger banks have more businesses to offset a decline in loan margins while regional banks are more sensitive to the yield curve.
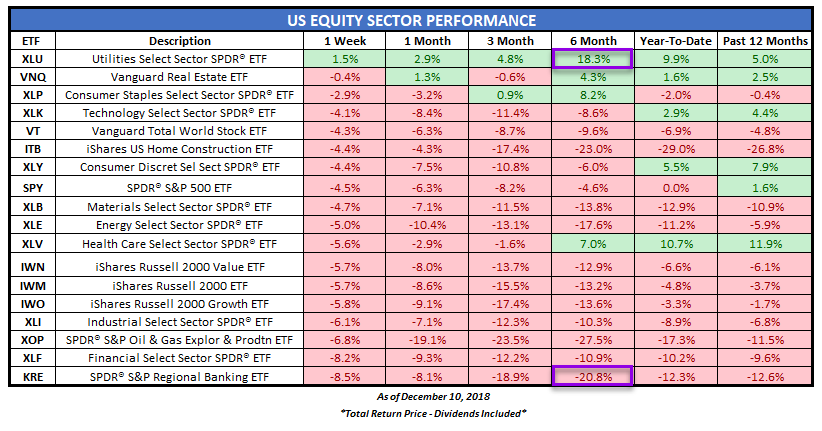
The following table highlights the recent underperformance of regional banks and large money center banks relative to other sectors in the domestic equity market.
KRE is the third worst performing sector over the past six months, declining nearly 21%. On the contrary, a defensive sector, utilities (XLU) is up 18% over the same six month time period.
Equity Sector Performance:
Source: EPB Macro Research
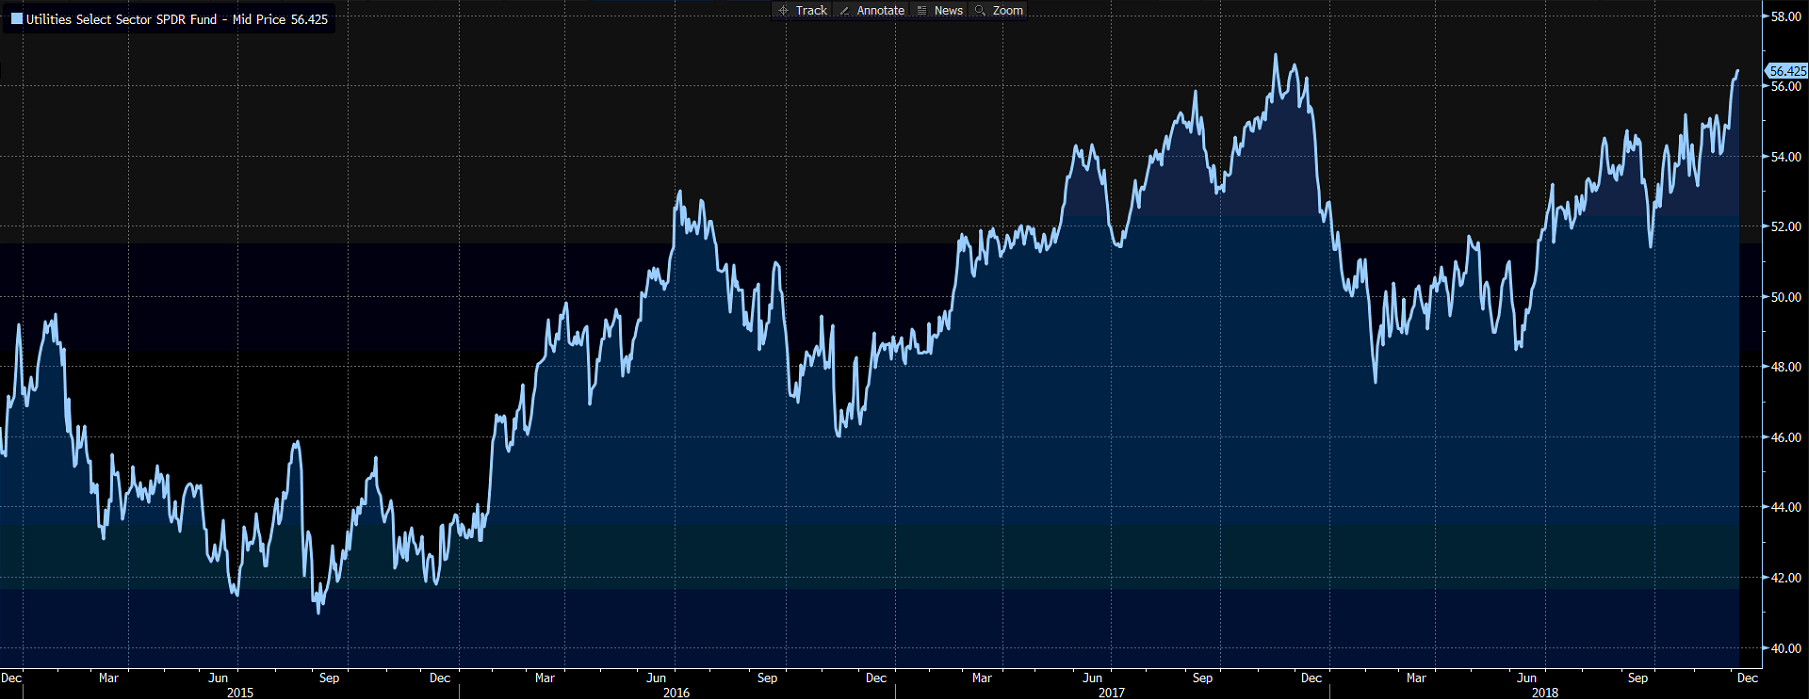
I have expressed vocal opposition to regional banks, calling for a long position in XLU vs. a short position in KRE dating back to May 2018. I started to write a series on how to play the end in the bank rally which you can find by clicking here. Since making that idea public, this idea could have returned nearly 40% as XLU nears 52-week highs. In my marketplace service, EPB Macro Research, we are still holding this trade that was initiated in May.
XLU Near New Highs Despite Stocks Selling Off:
Source: Bloomberg
The main reason that bank stocks have underperformed so dramatically is due to the yield curve.
As the yield curve continues to flatten, bank margins will be under pressure. It is my forecast that growth and inflation will continue to slow, pushing the yield curve deeper into inversion territory, a negative for bank stocks.
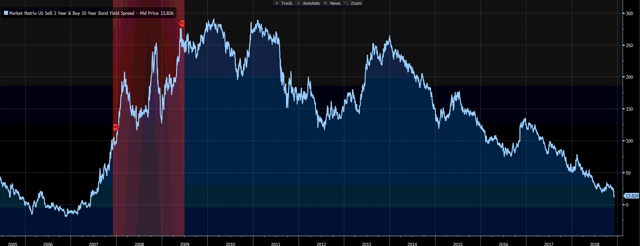
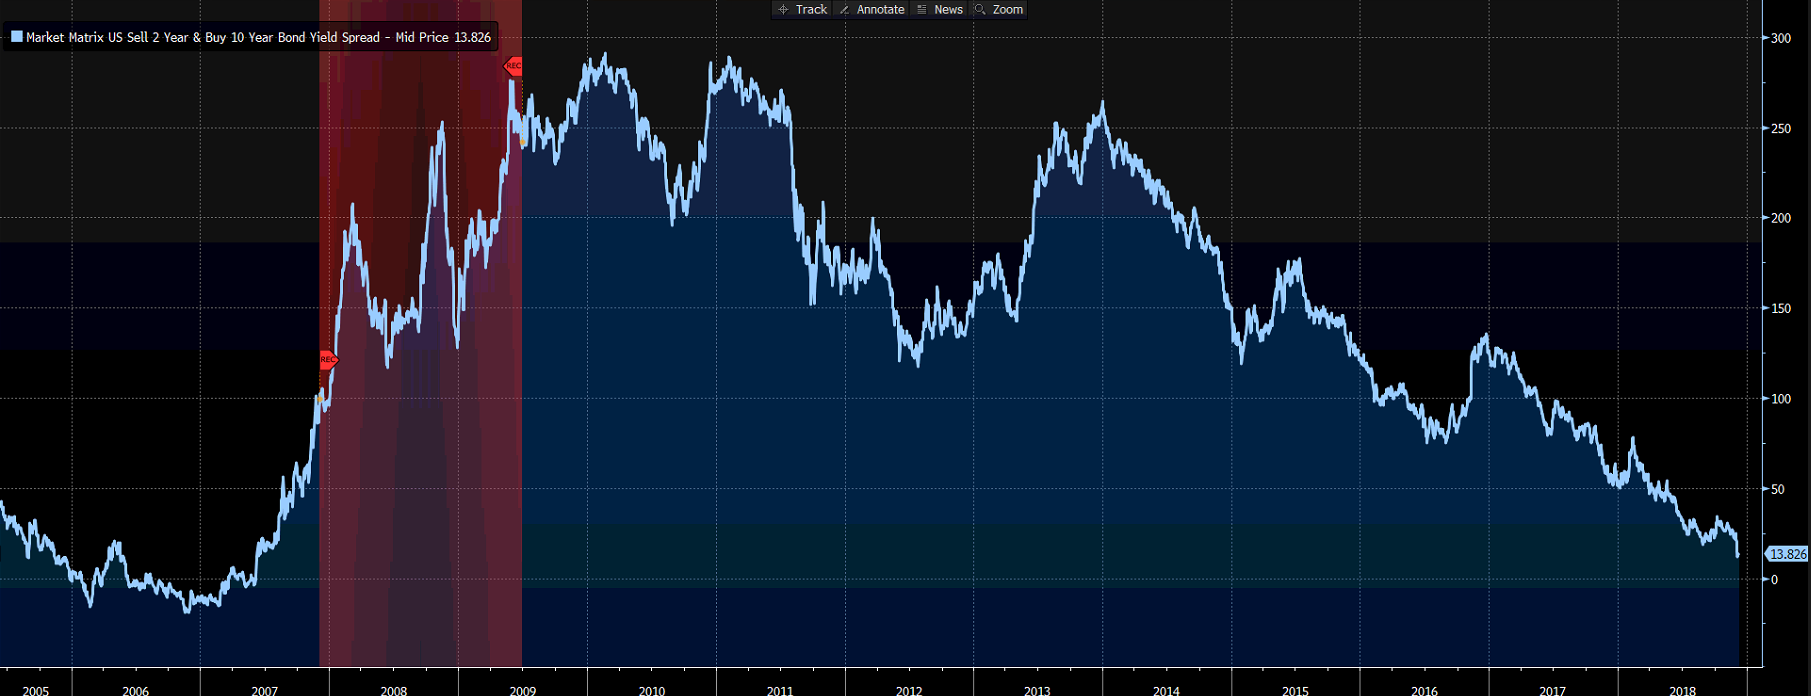
The spread between the 10-year Treasury rate and the 2-year Treasury rate, the most popular proxy on the shape of the yield curve, has fallen to 13 basis points, reaching an intra-day low of nine basis points last week.
2s10s Spread:
Source: Bloomberg
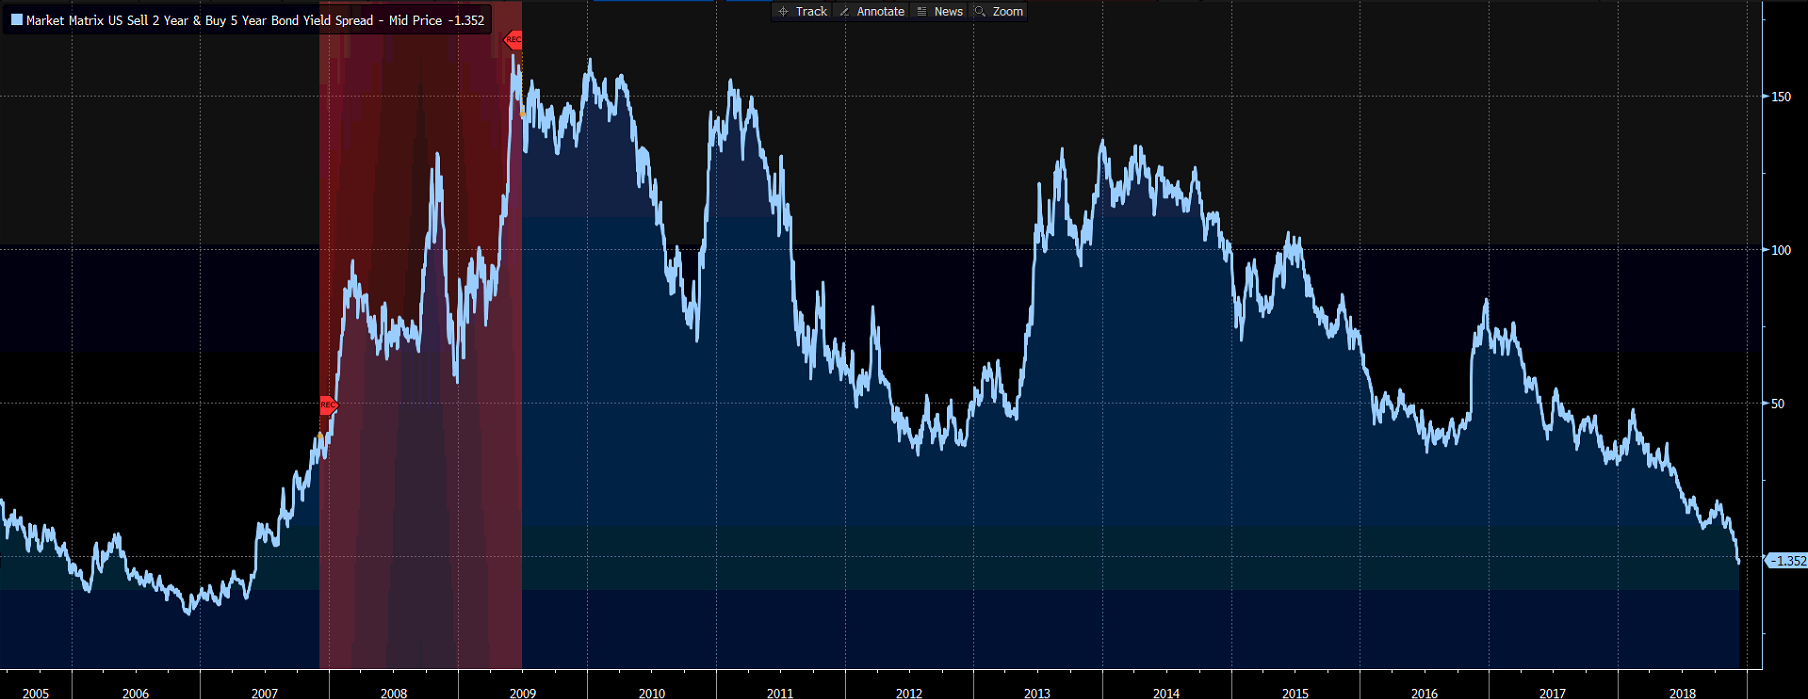
Other parts of the yield curve, such as the front end, proxied by the difference between the 5-year Treasury rate and the 2-year Treasury rate has already inverted.
The gap between the market expectations for future rate hikes and the Federal Reserve’s current language has caused a dramatic flattening of the yield curve. The market has priced out nearly every rate hike in 2019 and has made the December rate hike all but a coin toss based on Federal Funds futures data. It would be highly unlikely for the Fed, based on history, to hike rates if the market expects the move with less than 70% certainty.
December Rate Hike Odds As Of 12/10:

Source: Bloomberg
The problem is that the market can change expectations much faster than the Federal Reserve can switch from tightening to easing. Given that the Federal Reserve has a tremendous influence over short-term rates, the short-end of the yield curve is a bit more “sticky” than the long-end of the curve in terms of Fed policy.
For example, even if the Federal Reserve decides to skip the rate hike in December, the Fed Funds rate will still be at an upper limit of 2.25%. This puts an anchor around short-term rates in the mid 2% range. Long-term rates, such as the 10-year rate, are not influenced as much as short-term rates, responding more to market forces such as growth and inflation, and can slice through 2.5% in a matter of weeks should conditions call for a decline in rates.
Just last week the 10-year Treasury rate declined 16 basis points in a matter of days. The slow pace at which the Federal Reserve is able to change policy risks a more profound inversion of the yield curve should growth expectations continue to come down.
A further inversion of the front-end of the curve or fresh inversion that includes long-term rates will likely push bank stocks another leg lower.
2s5s Spread:
Source: Bloomberg
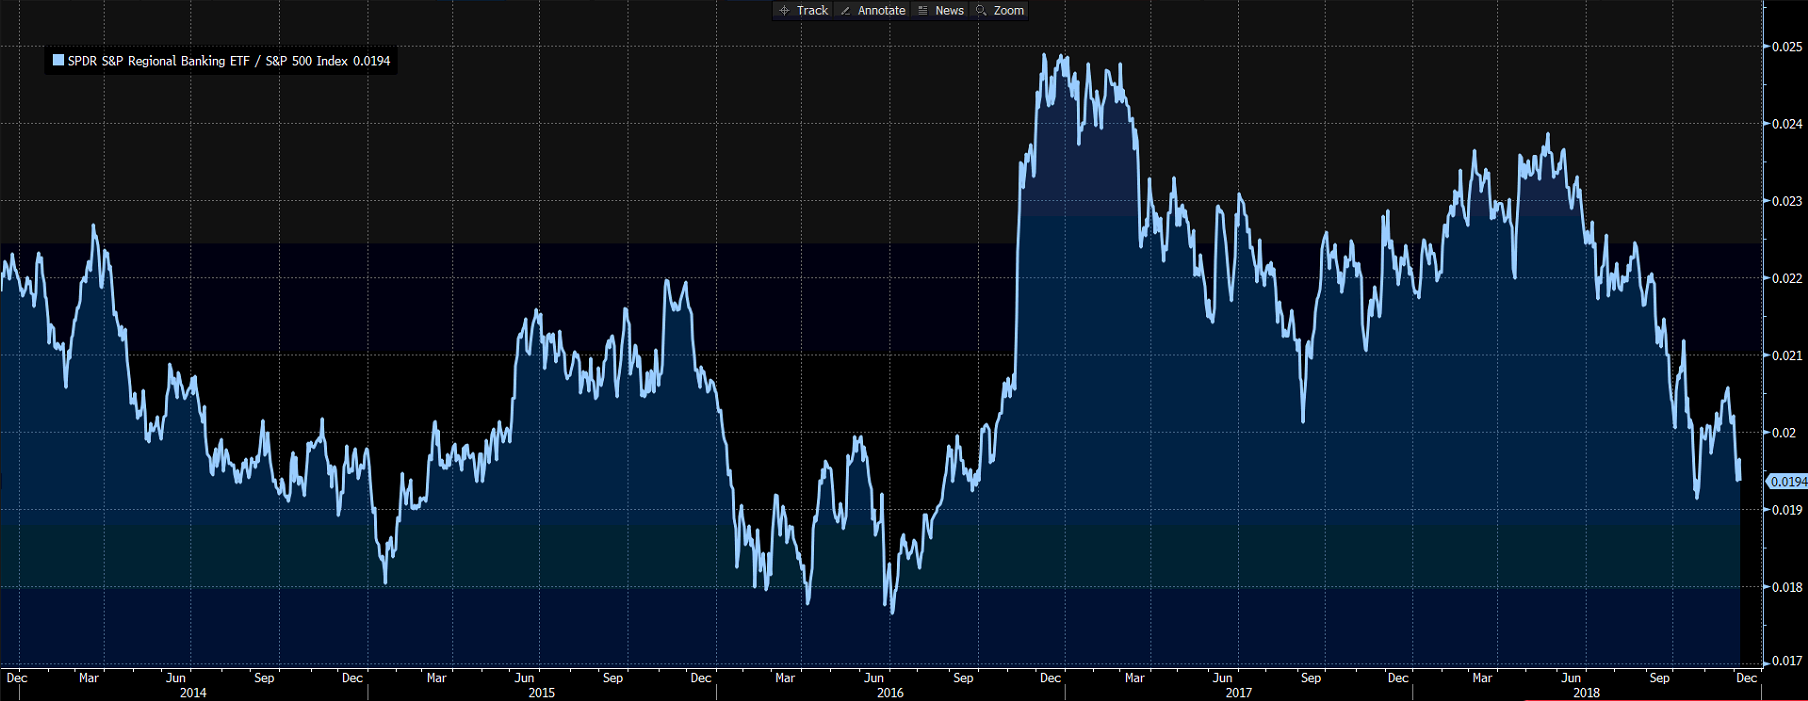
The dramatic underperformance of regional bank stocks relative to the broader market can again be highlighted by the spread between KRE and (SPY). As this ratio moves lower, KRE is underperforming SPY. The performance spread is moving towards the lowest level since the November 2016 election when bank stocks began a historic run on hopes of deregulation and tax cuts.
KRE / SPY:
Source: Bloomberg
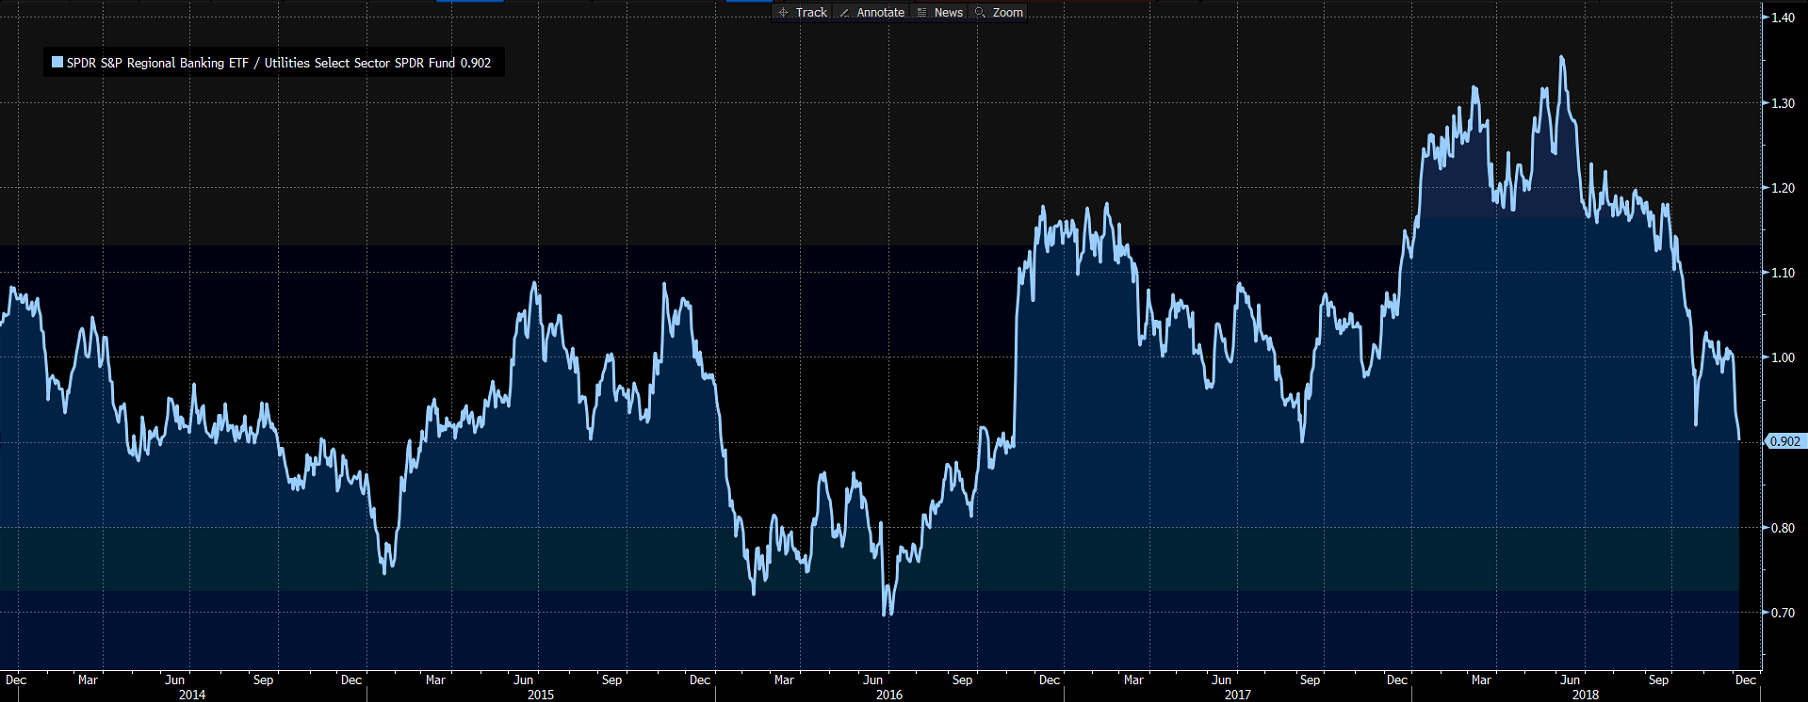
An even more dramatic spread and the trade that has been on in the model portfolio of EPB Macro Research is KRE vs. XLU.
KRE / XLU:
Source: Bloomberg
I have been sticking with this trade in the face of constant calls for a reversal to occur imminently due to one simple principle; if growth continues to decelerate, utilities will outperform bank stocks.
Since the summer, growth expectations have done nothing but come down, and as a result, the yield curve has compressed, and bank stocks have paid the price.
Growth expectations are a more powerful force than tax cuts and share buybacks, which were the two most commonly cited reasons to be on the other side of this trade.
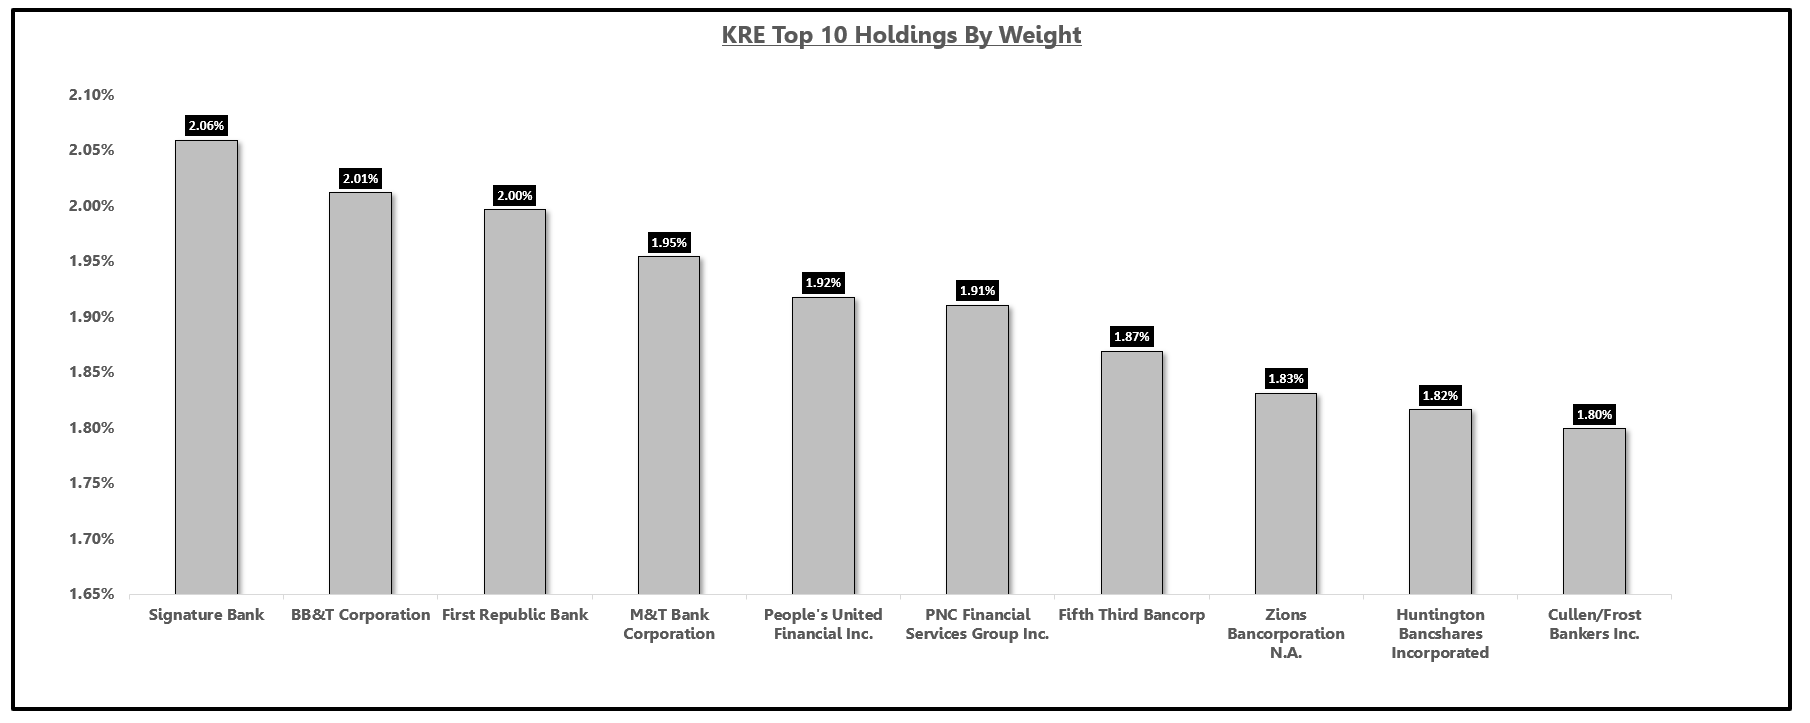
The KRE ETF is a great way to express this trade because the ETF is highly diversified in regional banks and not concentrated in one or two banks. The top 10 holdings only comprise roughly 19% of the ETF weighting, and no single stock has significantly more than a 2% allocation in the ETF.
Top 10 Holdings In KRE by Weighting:
Source: Bloomberg
One of the single most profitable things you could have done in your portfolio over the summer was to move in utility stocks and either short regional banks or remove them from your portfolio.
I will continue to update this position to subscribers, but followers can get a gauge on my thoughts by referring back to growth expectations. Is there more downside in KRE?
Well, if you think growth is done slowing, you may want to take profits on this trade. If you think growth will continue to move lower into 2019, the yield curve will likely invert further, and bank stocks will suffer as a result.
I am in the latter camp, suggesting that growth will continue to slow as we move into 2019. Over the next several months, bank stocks will continue to be under pressure on an absolute basis but more importantly, on a relative basis to the broader market and specifically to defensive sectors such as utilities.
Risk Management & Portfolio Allocation Strategy
EPB Macro Research uses macroeconomic data to identify inflection points in the economy and provides two asset allocation models that are best suited for the current environment so that your portfolio is always protected from the next downturn.
If you would like to see the complete asset allocation model with exact percentages, consider joining EPB Macro Research.
There is no risk in trying EPB Macro Research for a free two weeks.
Be prepared for the next major market move.
Disclosure: I am/we are long XLU.
I wrote this article myself, and it expresses my own opinions. I am not receiving compensation for it (other than from Seeking Alpha). I have no business relationship with any company whose stock is mentioned in this article.
Additional disclosure: Short KRE
Be the first to comment