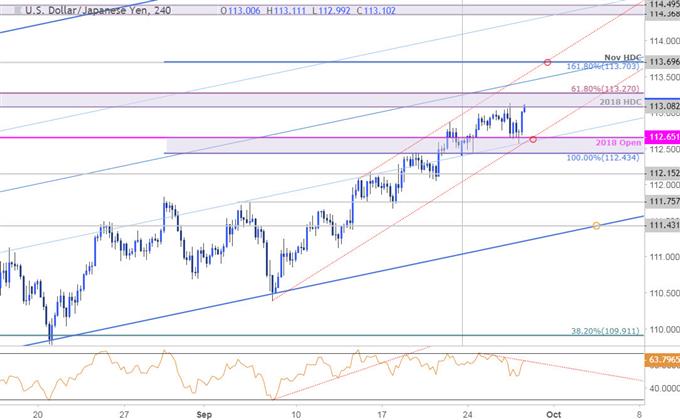
The Japanese Yen has continued to trade within the confines of an ascending pitchfork formation extending off the yearly lows with price now approaching resistance just ahead of the median-line / yearly highs. Here are the updated targets and invalidation levels that matter on the USD/JPY charts heading into the start close of September trade. Review this week’s Strategy Webinar for an in-depth breakdown of this setup and more.
USD/JPY Daily Price Chart
Technical Outlook: In my most recent Weekly Perspective on the USD/JPY, we highlighted a key resistance zone at 112.65-113.27– a region, “defined by the 2018 open, the 200-week moving average and the 61.8% retracement of the 2017 decline. Note that this zone stands just pips from the objective yearly opening-range highs at 113.38.” Price is trading in this region today ahead of the monthly close.
The immediate focus is on key daily resistance at 113.08/27 where the yearly high-day close converges on the 61.8% retracement- a breach / close above this threshold is needed to keep the long-bias in play targeting the November high-day close at 113.70. Daily support now rests at 112.65 and weakness below this level would risk a larger correction in price.
New to Forex Trading? Get started with this Free Beginners Guide
USD/JPY 240min Price Chart
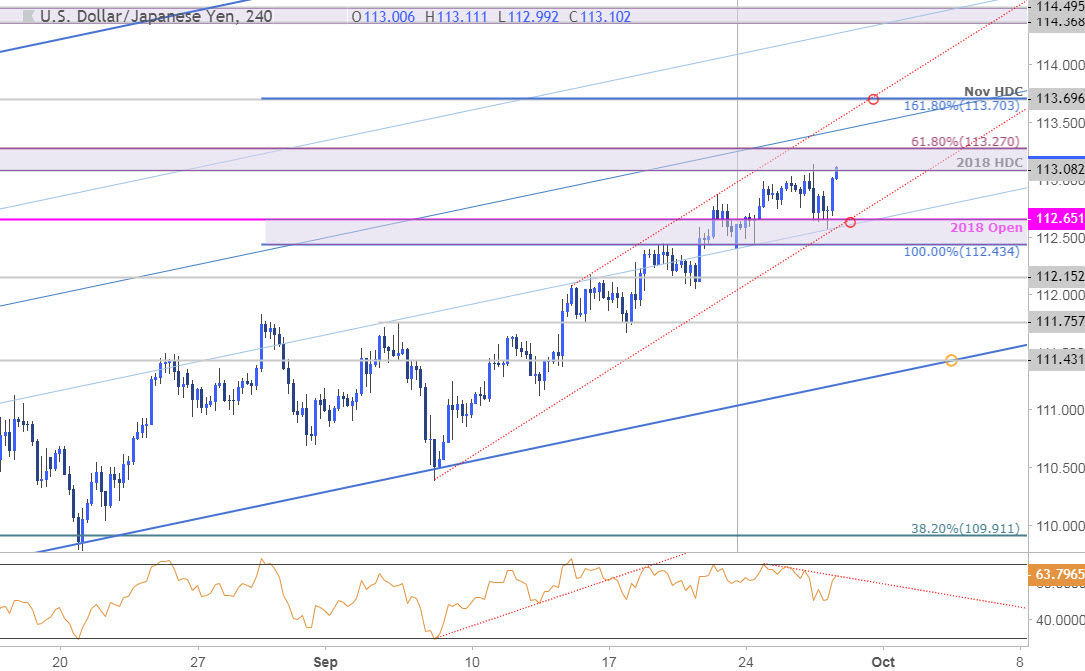
Notes: A closer look at price action shows USD/JPY trading within a near-term channel formation extending off the monthly lows, further highlighting support at 112.65. Near-term bullish invalidation stands with the weekly open / opening-range lows at 112.40/43. A break below this level would risk a larger correction with such a scenario targeting 112.15 backed by 111.75 and 111.43 – both levels of interest for possible exhaustion / long-entries IF reached. A topside breach of this resistance zone targets the median-line backed by the November high-day close / 1.618% extension at 113.70.
Why does the average trader lose? Avoid these Mistakes in your trading
Bottom line: The immediate focus is on a reaction off at this key resistance zone with the long-bias at risk while below the median-line. From a trading standpoint, this is a good place to book profits / raise stops and I’m looking for signs of exhaustion / short-entries in this zone. With that said, keep in mind that we are heading into the end of the month / quarter tomorrow and we’ll want to tread lightly here.
For a complete breakdown of Michael’s trading strategy, review his Foundations of Technical Analysis series on Building a Trading Strategy
USD/JPY Trader Sentiment
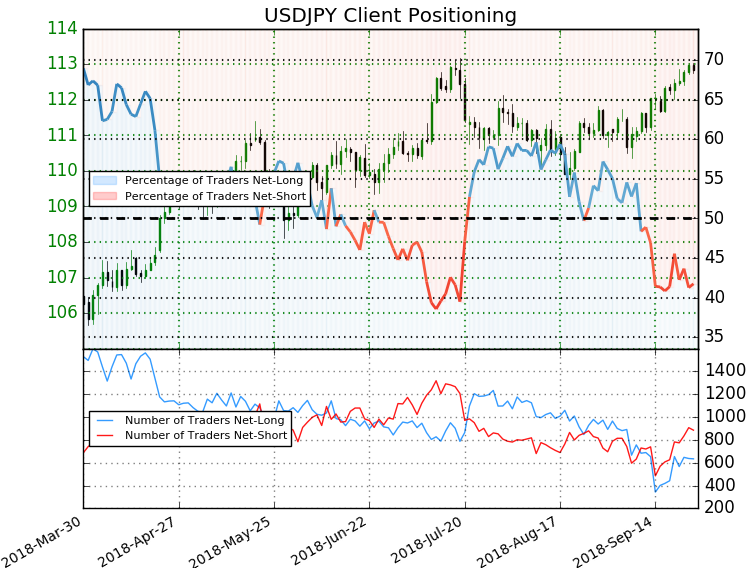
- A summary of IG Client Sentiment shows traders are net-short USD/JPY – the ratio stands at -1.4 (41.7% of traders are long) – weak bullishreading
- Traders have remained net-short since September 13th; price has moved 0.7% higher since then.
- Long positions are1.7% lower than yesterday and 47.4% higher from last week
- Short positions are 8.2% higher than yesterday and 46.5% higher from last week
- We typically take a contrarian view to crowd sentiment, and the fact traders are net-short suggests USD/JPY prices may continue to rise. However traders are more net-short than yesterday but less net-short from last week and the combination of current sentiment and recent changes gives us a further mixed USD/JPY trading bias from a sentiment standpoint.
See how shifts in USD/JPY retail positioning are impacting trend- Learn more about sentiment!
—
Relevant USD/JPY Economic Data Releases

Economic Calendar – latest economic developments and upcoming event risk. Learn more about how we Trade the News in our Free Guide!
Active Trade Setups
– Written by Michael Boutros, Currency Strategist with DailyFX
Follow Michael on Twitter @MBForex or contact him at [email protected]
Be the first to comment