After the beating that stocks took last week, investors are wondering if the coming week will witness a selling climax or if the October slide has further to go. As we’ll discuss in today’s report, the technical weight of evidence suggests that the sellers still have a technical advantage in the immediate term. I’ll also make the case that if the market continues its slide this week without attempting a relief rally, it will still be on track for a bottom by the middle of this month.
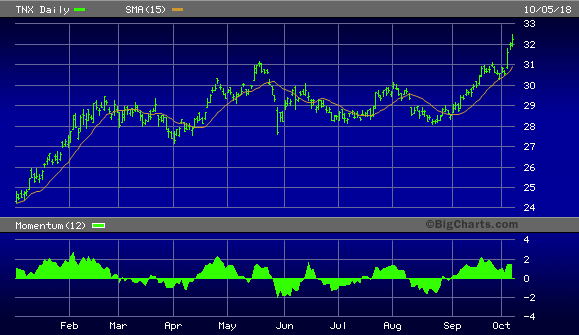
Stocks were hammered in the last two trading sessions as a powerful spike in Treasury yields forced mass liquidation of rate-sensitive securities. On Oct. 5, the benchmark 10-year yield jumped three basis points to 3.23%, extending its weekly gain to 16 basis points and marking its highest close since 2011. The latest rise in yields has been across all maturities, but particularly in longer-term government debt. Investors have lately expressed concern that higher yields are weighing especially hard on areas which would be negatively impacted by higher borrowing costs, including real estate and automobiles.
Shown below is the graph of the 10-Year Treasury Note Yield Index (TNX), which underscores the market’s number one headwind right now. As a consequence of the bond yield spike, there has also been increasing weakness among income funds listed on both exchanges, especially the NYSE, and it finally spilled over into the rest of the market last week as previously anticipated.
Source: BigCharts
An immediate result of the rate spike is that there has been a major increase in the number of new 52-week lows on the NYSE in recent days. On Thursday there were 430 new lows – the highest number since Feb. 6 – while there were 396 on Friday. This income fund-related selling pressure is essentially a repeat of the January-February broad market correction, albeit on a smaller scale. As long as the new 52-week lows are in the triple digits and outpacing the new highs, the market will face the risk of additional selling pressure.
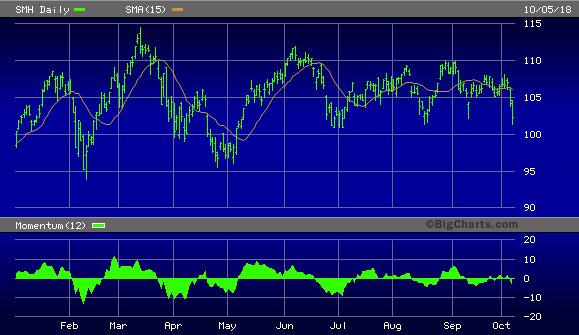
While selling pressure in rate-sensitive securities is especially pronounced, there is a growing list of industry groups which are joining the bear party. Among the weakest groups in the tech sector right now are the semiconductors. The fact that the semis are in a position of relative weakness isn’t encouraging for the short-term broad market trend, for a healthy stock market is normally characterized by strength, if not leadership, in the semiconductor stocks. The VanEck Vectors Semiconductor ETF (SMH) reflects this industry-wide weakness (below). Until we see the semis reverse this recent underperformance, investors should avoid new commitments to the tech sector in general and the semis in particular.
Source: BigCharts
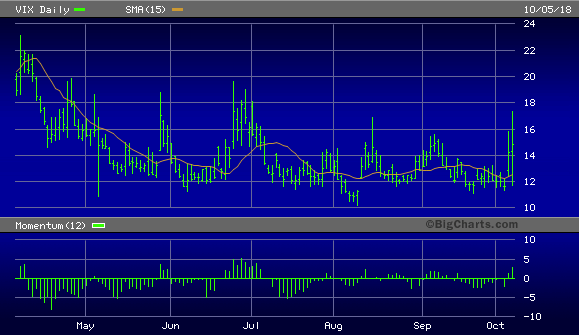
Another point worth mentioning is the latest increase in market volatility as reflected in the CBOE Volatility Index (VIX). This latest increase in choppiness marks the first time since June the VIX has been this lively. The repeating pattern this year has been that whenever VIX reflects just 5-6 days of above-normal volatility, the market soon thereafter finds a bottom. We’re only two days into the latest volatility spike, so we’ll likely have a few more days of downside pressure to go before the market’s next immediate-term (1-4 week) low.
Source: BigCharts
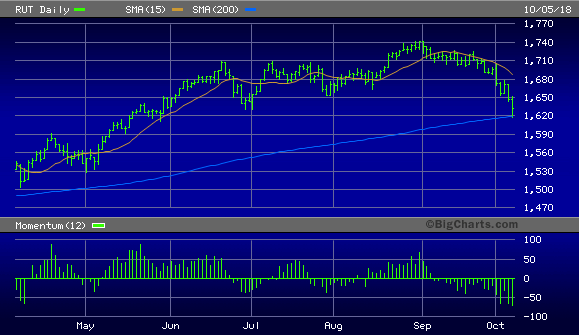
Speaking of the immediate term, the latest week ended with all the U.S. major indices closing decisively under the 15-day moving average. This puts our immediate-term (1-4 week) trend indicator back on a “sell” and is another reason for remaining defensive as we head into the latest quarterly reporting period. Small cap stocks remain the downside leaders. The Russell 2000 Index (RUT) serves as an indicator of this extreme weakness, as can be seen in the chart below. At no point this year has the RUT broken its psychologically significant 200-day moving average. However, it’s currently testing the 200-day trend line and may end up breaking it before this latest correction has ended. The weakness in the small caps isn’t fundamentally based, however, but is primarily technical in nature. That is, the run-up in the small caps this summer put them in an exceptionally “overbought” condition and thereby made them more vulnerable for a sharp pullback. Ideally, we should see the small caps bottom and reverse before the latest broad market correction is over.
Source: BigCharts
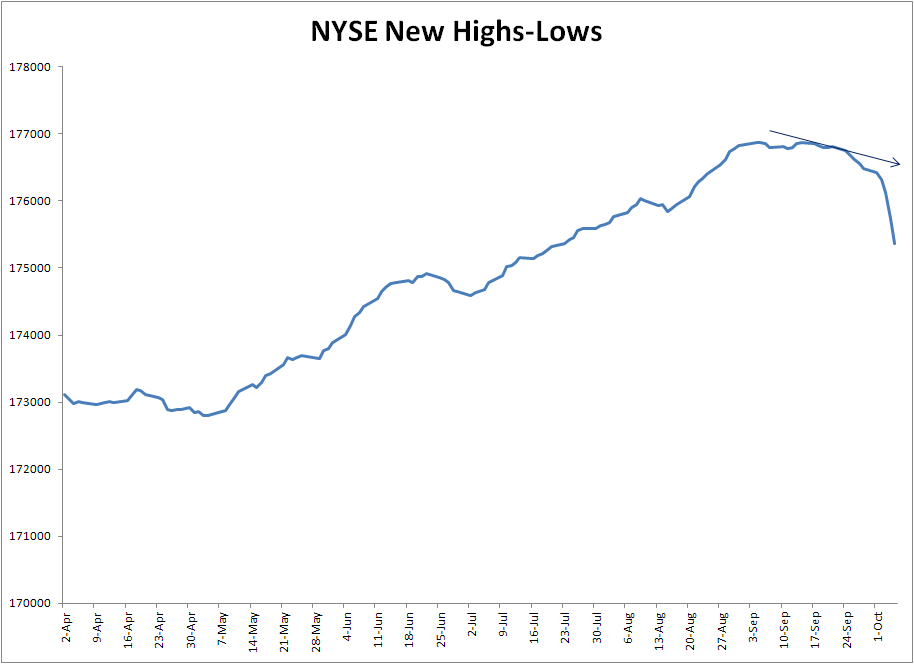
Turning our attention to the market’s internal profile, the cumulative new highs-lows indicator for the NYSE is one of my most important indicators for determining the near-term path of least resistance for stocks in the aggregate. As you can see here, it has been downward sloping for the last two weeks. This is the first time in several months that this important indication of incremental demand for equities has been declining. My constant refrain in this commentary for the last several months has been that as long as the cumulative highs-lows ratio we in a rising trend, investors were justified in maintaining a bullish short-term bias. The weakness now manifest in the graph shown below means that investors should maintain a defensive position for now until the trend in the cumulative highs-lows reverses its downward trend.
Source: WSJ
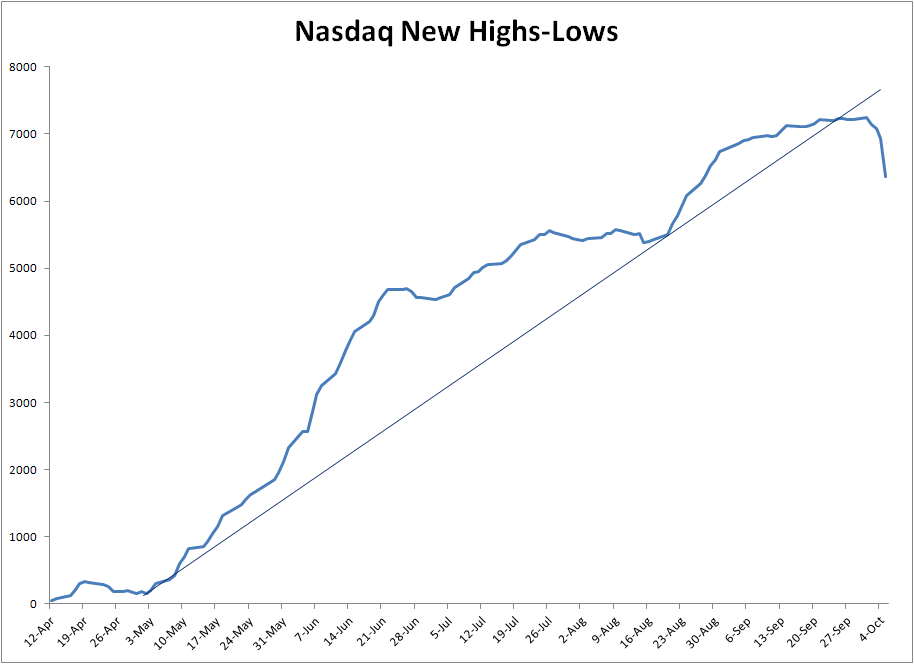
Meanwhile on the tech front, the Nasdaq cumulative 52-week highs-lows broke a multi-month rising trend line last week. Since then, the trend in the highs and lows on the Nasdaq has been getting weaker and is confirming that sellers have the advantage in the immediate term. Earlier this summer the tech stocks were the beneficiaries of sector rotation-related buying. Now the over-extended Nasdaq stocks are subject to above-normal selling pressure. Tech stock investors should also remain defensive and avoid new long positions in the Nasdaq stocks until this indicator shows improvement.
Source: WSJ
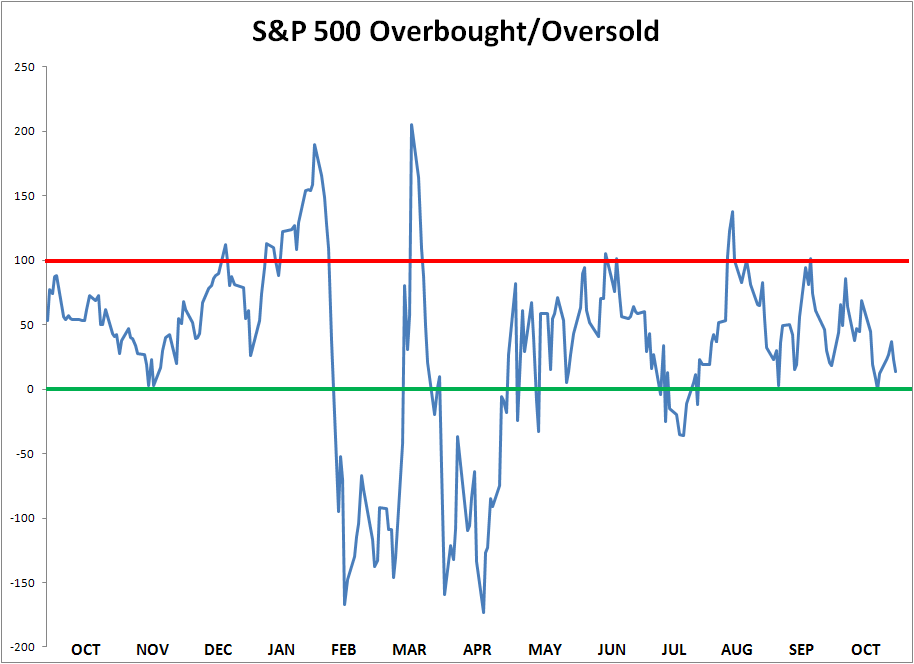
Another worthwhile consideration is the short-term technical profile for the S&P 500 Index. The 20-day price oscillator for the SPX measures how “overbought” or “oversold” the large cap stock market is. It compares the latest close of the S&P with the closing value from 20 trading days ago. Doing this enables us to evaluate whether the market is running “hot” or “cold”. For the last several weeks, the S&P 500 was clearly in an overheated technical condition based on the extremely high level of the 20-day oscillator (below). When this happens, the stock market becomes vulnerable to a corrective pullback (although the timing of the pullback isn’t always easy to nail down).
Source: WSJ
After the market has experienced a meaningful pullback (i.e. around 4-5% or greater), the 20-day oscillator for the SPX should ideally return to a normal, healthy level. Normally the oscillator falls below the zero level and into “oversold” territory. Once this happens, the market will become vulnerable to short covering and will then be in a position to establish a bottom. As of Oct. 5, the 20-day oscillator shown above hasn’t yet fallen under the zero level. While this implies that the market-wide internal correction hasn’t ended yet, another day or two of declining stock prices will almost certainly put the oscillator into oversold territory. The further below the zero level the oscillator falls, the more likely that the stock market’s next bottom will be followed by a sharp recoil rally. The current position of the 20-day oscillator suggests that a short-term bottom could be in by mid-month.
With long yields rising, my expectation is that the stock market will continue to experience short-term headwinds. Investors should therefore expect to see spillover weakness in equities in the coming days. Given the extreme pace of rate-sensitive securities liquidation, however, a bottom should be in soon. My best guess is that by the middle of the month we’ll have a confirmed low based on the extremely high number of new 52-week lows and the fact that the 20-day price oscillator for the S&P 500 Index is getting close to a sold out reading. However, as long as the 10-Year Treasury Note Yield Index remains in a rising trend and bond fund liquidation continues, investors should wait for the market to confirm a bottom rather than anticipating one.
I also reiterate my recommendation that investors refrain from initiating new long positions in stocks and ETFs until the internal weakness has lifted. Once the new 52-week lows on both major exchanges return to normal for a few days (i.e. below 40), we’ll have a strong indication that the latest storm has passed. Investors can, however, continue to maintain a longer-term bullish exposure to the stock market via ETFs and outperforming individual stocks in strong sectors. This includes in particular the retail, health care, and tech sectors, which have all shown relative strength versus the S&P 500 Index in recent months. With earnings growth still on a positive trajectory and Nasdaq internal momentum still bullish, the probability is strong that the large cap major averages will survive my projected increase in October volatility with their bullish long-term trends remaining intact. I also recommend raising stop losses on existing long-term positions and taking profits in stocks and ETFs which have already had impressive upside moves.
Disclosure: I am/we are long XLK, XLV.
I wrote this article myself, and it expresses my own opinions. I am not receiving compensation for it (other than from Seeking Alpha). I have no business relationship with any company whose stock is mentioned in this article.
Be the first to comment