As the oil and gas space has taken a beating, there appear to be a number of gems out there trading at attractive multiples. Many of these are E&P (exploration and production) firms, others are suppliers to E&P firms, and others still perform various services for them. One of the service providers that continually pops up on my radar is Enterprise Products Partners (EPD), a pipeline operator with significant operations throughout Texas and that focuses on NGLs (natural gas liquids). Based on my analysis, shares of the firm look incredibly appealing and offer, over the next couple of years especially, meaningful upside potential.
Cash flow is robust
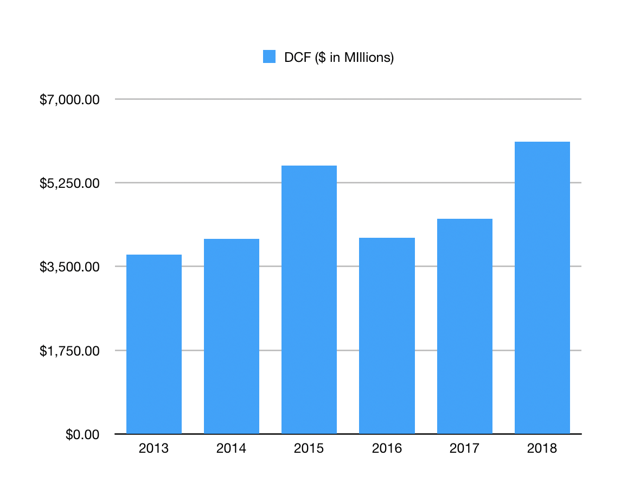
Perhaps the most-followed financial metric of pipeline operators and other high-yield companies is DCF (distributable cash flow). This is the amount of cash management technically has left throughout the year in order to distribute to shareholders if it so desires. In the graph below, you can see the DCF generated by Enterprise each year between 2013 and 2017 in accordance with its 10-K releases. The ride has been bumpy, but the trend is easy to see if you ignore the unusually-large DCF reported for 2015. Between 2013 and 2017, DCF soared from $3.750 billion to $4.502 billion, an annualized gain of 4.7%.
*Created by Author
Performance figures are still out for 2018 and management, despite providing guidance on capex and giving an idea as to the payout ratio it will be sticking with, does not offer annual DCF guidance for shareholders. Simply comparing results from the first three quarters of 2018 with the same three quarters of 2017, I concluded that a DCF figure in the range of $6.11 billion for 2018 is realistic (in the first three quarters alone, it was $4.402 billion). Due to significant capex spending over time, I believe a similar reading, if not a higher one, is likely for 2019, but we will only get a better idea as to whether or not that is realistic once fourth-quarter results are provided.
The company’s current pricing
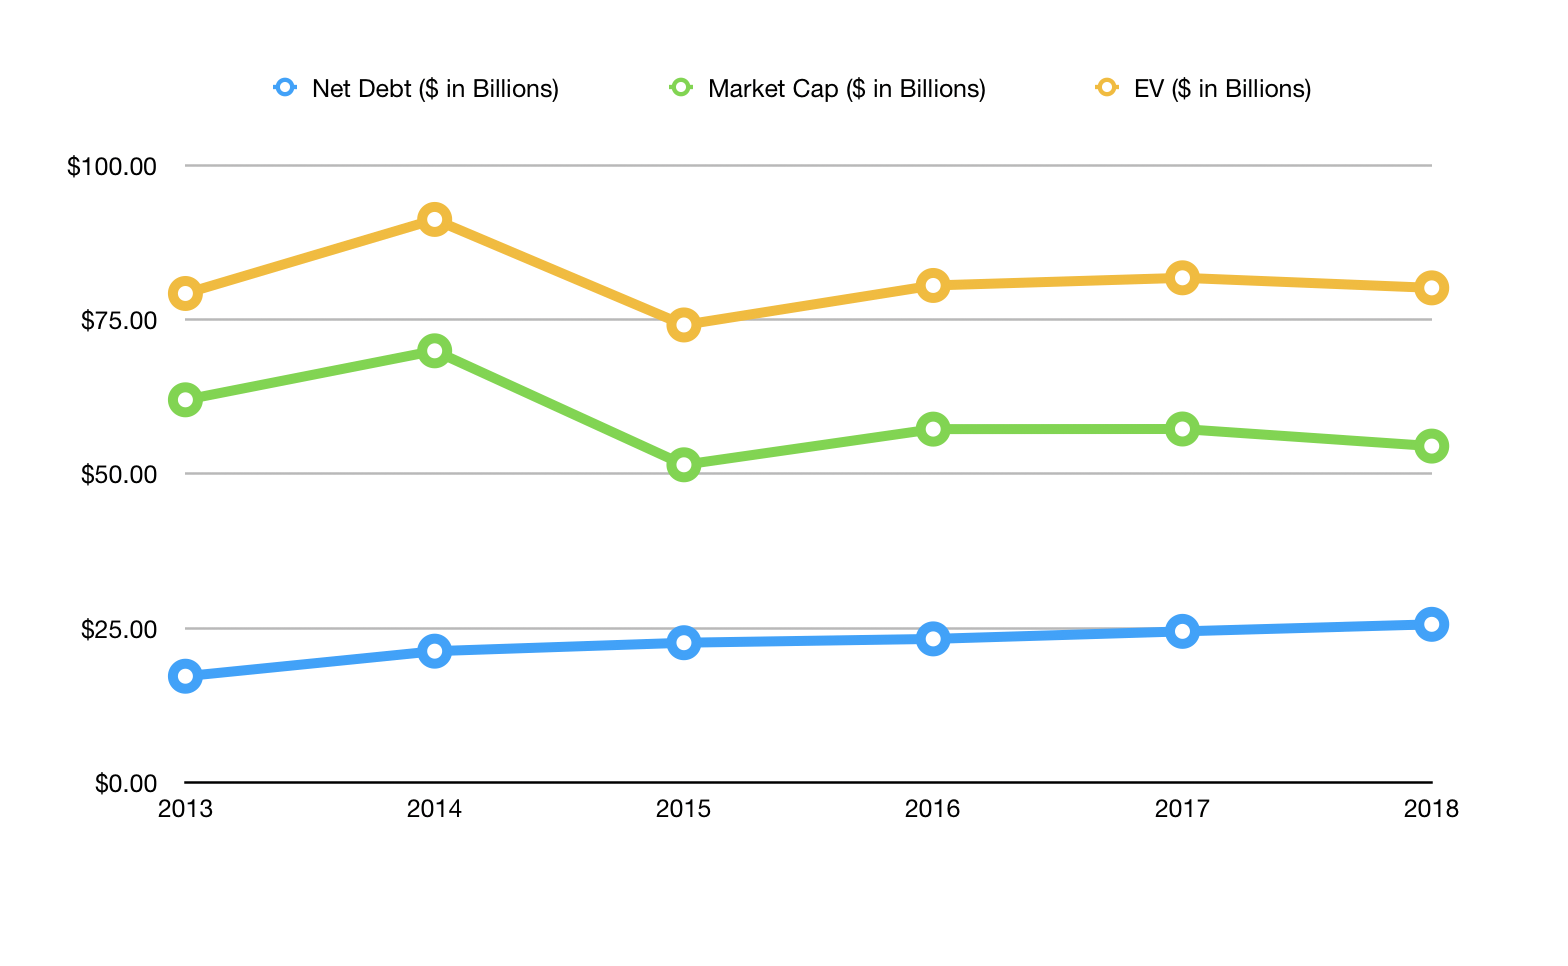
Over the past few years, the market capitalization of Enterprise has not changed all that much. After falling from $69.96 billion in 2014 to $51.49 billion in 2015, it moved up to the $54.51 billion that it’s at today. Debt, on the other hand, has been growing rather consistently. Back in 2013, net debt stood at $17.23 billion. Each year, that figure increased, growing until it hit $24.50 billion in 2017. As of the end of the third quarter last year, the company’s net debt came in at $25.64 billion.
 *Created by Author
In the graph above, you can see how both debt and the market value of equity has changed over time. In addition to that, you can see the EV (enterprise value) of the firm, which is essentially the sum of its net debt and equity. This is one important measure for investors because it indicates the collective value that the market is willing to put on the firm, plus the value that lenders believe the business is worth. As of the time of this writing, the EV for Enterprise stands at $80.16 billion, only slightly lower than 2017’s $81.79 billion.
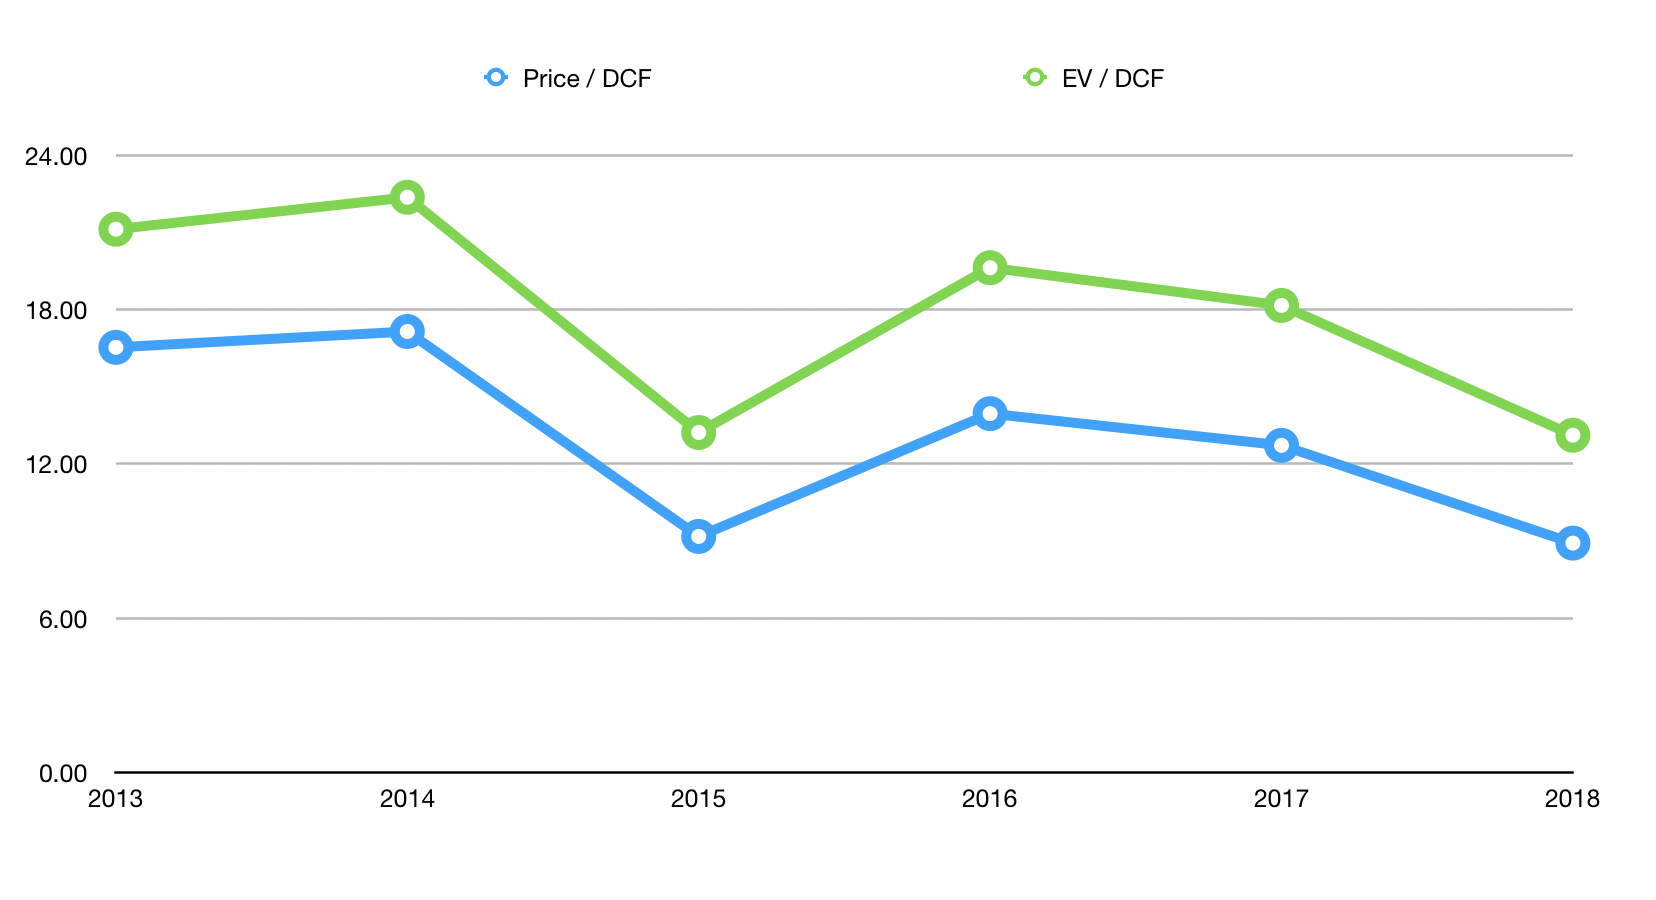
Using these different metrics, we are able to get some idea as to how the market is pricing Enterprise at this time. On a market cap/DCF basis, for instance, shares are trading at a multiple of only 8.9. On an EV/DCF basis, that reading goes up to 13.1. Neither of these appear to be particularly expensive, especially when you consider that Enterprise’s current annualized yield (which is only likely to grow) stands at 6.97% with a payout of $1.73 per unit each year.
Shares look cheap
To better appreciate where shares of Enterprise stand as of the time of this writing, we should look at how the company has been priced in the past. In the graph below, for instance, you can see the historic price/DCF and EV/DCF multiples shares have traded for between 2013 and 2017, as well as what it’s trading for today. By both measures, Enterprise appears to be trading at a nice discount to any of the five preceding time frames. A big portion of this disparity could be chalked up to the general malaise centered around the energy space, combined with the possibility (though management has said they have not decided to do this yet) of a conversion to C-Corp status that could bite long-term investors in the firm.
 *Created by Author
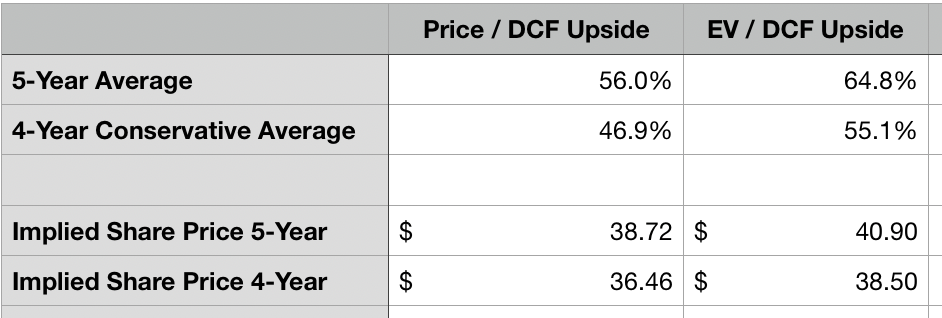
In the table below, I decided to lay out the average price/DCF and average EV/DCF multiples for the five-year period ending in 2017, and to provide the same averages but omitting the year with the highest multiple from the equation to give a more conservative multiple. What the data shows is that, if we head back to historic averages, shares of Enterprise should be valued at between 46.9% and 64.8% above where they are today. That translates to a share price of between $36.46 and $40.90.
 *Created by Author
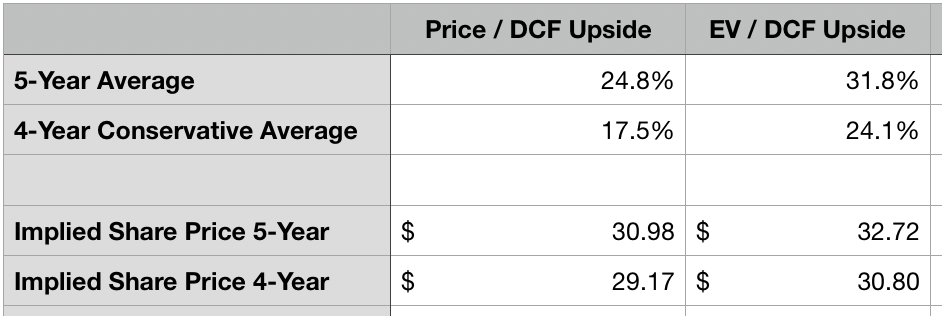
As a value investor, my goal is to remain conservative in my analysis and that means applying a sufficient margin of safety. Generally, this results in applying a 30% margin, but given the nature of and low risk I believe is inherent in Enterprise’s business model, a 20% margin of safety is probably far more than appropriate. In the table below, you can see the suggested price range I came up with for shares based on this margin. In short, shares should likely be priced comfortably between $29.17 (an increase of 17.5%) and $32.72 (an increase of 31.8%) apiece. The yield, under this range, would be between 5.3% and 5.9%, which is still attractive in this environment.
 *Created by Author
Takeaway
No matter how I look at it, Enterprise appears to be a fantastic prospect for the right kind of investor. Anybody who wants a great-quality company with strong and growing cash flows, an attractive distribution, and that is sitting in a prime location (Texas with access to the Permian Basin) would be remiss to not consider jumping into the business, especially if they are long-term investors and have several years between now and retirement where they can continue to roll over distributions in exchange for higher compounded returns.
A community of oil and natural gas investors with a hankering for the E&P space: Crude Value Insights is an exclusive community of investors who have a taste for oil and natural gas firms. Our main interest is on cash flow and the value and growth prospects that generate the strongest potential for investors. You get access to a 50+ stock model account, in-depth cash flow analyses of E&P firms, and a Live Chat where members can share their knowledge and experiences with one another. Sign up now and your first two weeks are free!
Disclosure: I/we have no positions in any stocks mentioned, and no plans to initiate any positions within the next 72 hours. I wrote this article myself, and it expresses my own opinions. I am not receiving compensation for it (other than from Seeking Alpha). I have no business relationship with any company whose stock is mentioned in this article.
Be the first to comment