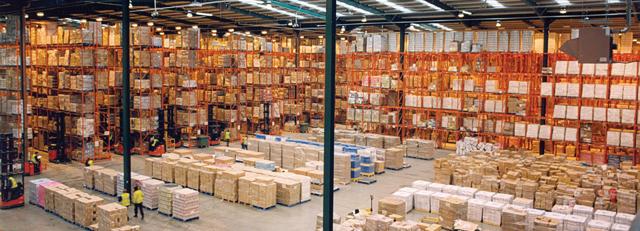
Source: Axisadman

Inventories Are Everything
Reviewing the Q3 2018 GDP report, I wrote this:
If you want one takeaway from this report, try this on: without changes to private inventories, this is a 1.2% print, not 3.5%1 – inventories accounting for a stunning 65% of growth in the quarter. It better be a merry Christmas, or there’s going to be some overstocked warehouses… The disposition of these inventories remains the key short-term issue facing the US economy.
Following this up at year’s end with my 2019 Outlook:
What we want to see in Q4 is a big reduction in inventories coupled with high growth in wholesale and retail trade, hospitality services and a better trade picture. In short, the Merriest of Merry Christmases. If inventories remain high or grow, or exports don’t recover, it is an extremely troubling sign, and would likely mean we are on the precipice of a recession, if not already in one.
Because of the shutdown, the first Q4 GDP report was delayed for a month, and so we have been flying a little blind with regards to what happened in November and December; the suspense ends on Thursday with the first release of that report. The weekly Redbook Index of same-store retail sales has been good, though not especially so, and Costco (COST) and Walmart (WMT) showed strong year-over-years.
But then, on Valentine’s Day, the disastrous December retail numbers came out, showing a 1.2% year-over-year decline. For once, I was in agreement with Larry Kudlow that this was a “glitch” in a preliminary data set. The other retail data we had was not especially strong, but certainly not indicative of a cratering of retail during a Christmas season when consumer sentiment was very high, though declining from its peaks.
The December inventories and sales report released Monday is not encouraging to say the least, and the glitch hypothesis just took it on the chin. Like the retail report, these are still preliminary numbers, but the news is almost all bad. Inventories rose, not declined in December, and the November revisions were upward. The ugly table (RED is bad, GREEN is good):
| Type of Business |
Sales MoM Growth |
Sales YoY Growth | Inv. MoM Growth | Inv. YoY Growth |
Inv-Sales Ratio MoM Growth |
Inv-Sales Ratio YoY Growth |
|
U.S. Total |
-1.0% |
1% |
1.1% |
7.3% |
2.31% |
6.40% |
|
U.S. Total ex-Petrol |
0.4% |
2.0% |
1.3% |
8.1% |
0.84% |
6.01% |
|
.Durable |
0.7% |
3.6% |
1.5% |
10.6% |
0.60% |
6.37% |
|
..Automotive |
-2.2% |
-0.3% |
0.9% |
7.3% |
2.99% |
7.50% |
|
..Furniture |
4.4% |
2.1% |
2.4% |
8.9% |
-2.00% |
6.52% |
|
..Lumber |
-1.2% |
-5.3% |
2% |
14.9% |
3.16% |
21.64% |
|
..Prof. equip. |
0.1% |
4.8% |
1.3% |
11.5% |
0.89% |
6.60% |
|
…Comp. equip. |
-0.5% |
9.0% |
0.6% |
16% |
1.25% |
6.58% |
|
..Metals |
-0.9% |
10.1% |
2.8% |
21.2% |
4.21% |
10.40% |
|
..Electrical |
4.2% |
3.4% |
2.2% |
6.5% |
-1.80% |
2.83% |
|
..Hardware |
-2.8% |
-4.4% |
1.7% |
12.1% |
4.67% |
17.28% |
|
..Machinery |
0.8% |
8.9% |
1.3% |
12.7% |
0.38% |
3.53% |
|
..Misc. Durable |
1.6% |
5.5% |
0.5% |
4.1% |
-0.68% |
-1.35% |
|
.Nondurable |
-2.5% |
-1.5% |
0.3% |
2.3% |
3.09% |
4.17% |
|
.Nondurable ex-Petrol |
0.2% |
0.0% |
0.8% |
3.9% |
0.66% |
3.89% |
|
..Paper |
-0.4% |
2.2% |
1.6% |
7.3% |
2.44% |
5.00% |
|
..Drugs |
0% |
4.3% |
-1.2% |
0.8% |
-0.95% |
-3.70% |
|
..Apparel |
0.4% |
-5.2% |
3.8% |
7.6% |
3.12% |
13.24% |
|
..Groceries |
0.9% |
0.7% |
0.5% |
1.4% |
0.00% |
0.00% |
|
..Farm products |
1.4% |
-9.5% |
0.3% |
8.3% |
-1.23% |
19.40% |
|
..Chemicals3 |
-2.4% |
-0.4% |
2% |
4.5% |
4.39% |
5.31% |
|
..Petroleum |
-11.1% |
-6.5% |
-4.8% |
-12.6% |
8.57% |
-5.00% |
|
..Alcohol |
2.2% |
8.8% |
0.7% |
2.4% |
-1.56% |
-5.97% |
|
..Misc. Nondur. |
-2% |
-7.6% |
2.4% |
6% |
4.46% |
14.69% |
Source: US Census Bureau
File under Not Good.
So, What’s Happening Here?
What’s happening is that companies stocked up inventories in advance of tariffs and Christmas, and the Yule season has failed to empty those inventories out through sales. Companies have even added to their inventories. The stunning 8% YoY rise in ex-petrol inventories, accompanied by weak sales growth, led to a rise in the Inventories-Sales Ratio to 1.45, a 6% rise in 2018. The signs are that corporate purchasers have badly miscalculated demand in many categories, and you can see those big numbers in red. Some lowlights:
- Autos
- Lumber
- Metals
- Hardware
- Apparel
- Farm Products
The biggest offset has been drugs, the largest of the non-durable categories, which has shown OK sales growth but reduced inventories.
Any Good News?
The best spin I can put on the report is that drugs were not completely awful, and alcohol sales were strong and drew down inventories, so we were all too drunk and stoned to notice what was going on.
What Does It All Mean?
Again, these are preliminary numbers, and we will be getting Q4 GDP later in the week, but this is not an encouraging report. It lends less credence to the hypothesis that the weak December retail numbers were just a glitch, and more to the idea that there is a deeper demand shortfall in the economy, despite the high consumer confidence numbers. If this is the case, we may be closer to recession than many people, including me, think.
In any event, no one but me seems to care. As I type this, the S&P off its high for the day, but still up 36 bps. The VIX, however, is up 4.6% at the same time, so there may be some worry in the futures.
Look for my macro update after the Q4 report early next week.
Thanks for reading. Comments? Questions? Insults? Have at it.
Endnotes
1 Those were the preliminary numbers. The finals were worse at 3.4% and 1.1%.
Disclosure: I am/we are long COST. I wrote this article myself, and it expresses my own opinions. I am not receiving compensation for it (other than from Seeking Alpha). I have no business relationship with any company whose stock is mentioned in this article.
Be the first to comment