Keeping some bond exposure in a rising rate environment may still temper a stock portfolio’s volatility without being a heavy drag, but it needs a process to allocate dynamically the capital to the right kinds of bonds. This article gives insights on a strategy with a real track record starting in December 2013 and its performance on various time frames.
History and rationale of the model
The first version of this model was designed in 2013. At this time, I had not yet started the research on market-timing indicators that resulted in the concept of systemic risk and MTS10. I just wanted a bond model outperforming the U.S. Aggregate Bond Index (AGG) (BND). It is a dynamic allocation model in a bond universe, inspired by readings on tactical asset allocation, mostly articles and white papers by Mebane Faber and Gary Antonacci. It belongs to the dual-momentum category: the absolute momentum indicator is calculated on a 10-month period, and the relative strength indicator is calculated on a trailing quarter. As I think complexity is a factor of fragility, the model is quite simple.
Evolution of long-term treasury bonds after QE
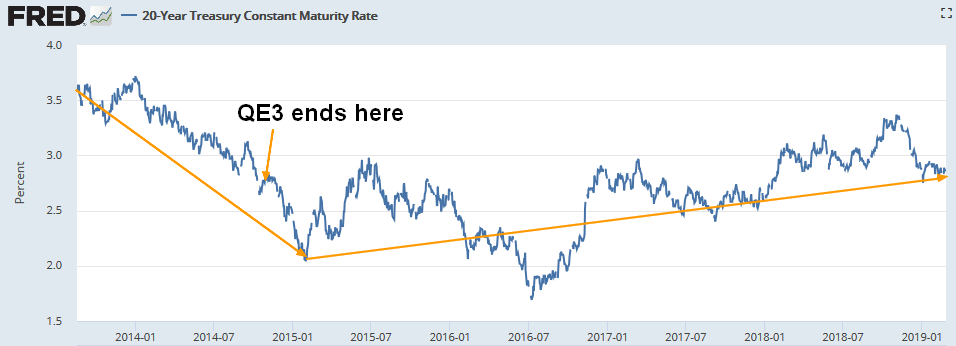
QE3 purchases were halted on 10/29/2014. The next 2 charts plot the 20-year treasury rate and the 20+ year treasury bond ETF (TLT).
20-Year Treasury Bond rate, from St Louis Fed database
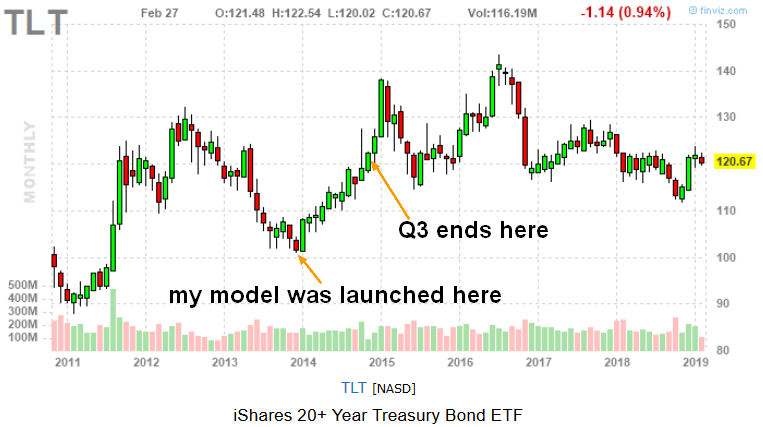 TLT price action, from Finviz
To simplify calculations and comparisons, we will consider hereafter than the post-QE period starts in 2015.
Performance since launch
I launched the first version of bond rotation for subscribers on another platform in December 2013, then I have added it later in my Seeking Alpha contribution as a part of Quantitative Risk & Value. Since 2013, the set of possible holdings has been slightly modified, but the basic rules are still the same. The next table shows the returns of the strategy since it is available to subscribers, compared with BND (the benchmark) and TLT. ETF dividends are reinvested.
|
2019* |
2018 |
2017 |
2016 |
2015 |
2014 |
2014-2018 |
Post-QE 2015-2018 |
|
|
Bond Rotation |
1.1% |
-0.7% |
6.3% |
10.8% |
-4.0% |
8.2% |
22.8% |
13.5% |
|
BND |
1.2% |
0.3% |
3.5% |
2.5% |
0.4% |
6.0% |
14.6% |
8.1% |
|
TLT |
-0.1% |
0.0% |
9.10% |
-0.28% |
-0.98% |
27.9% |
37.6% |
7.6% |
* YTD on 2/26
The table shows total returns by year since inception and post-QE. The Bond Rotation Model has fulfilled its objective, beating BND since 2014, and post QE. It has beaten TLT post-QE, but not in 2014. We can also have a look at simulations on past data.
Backtests
Results above are out-of-sample (after launching the strategy and making it available to subscribers). In an in-sample backtest from May 2009 to December 2013, the bond rotation would have returned over 17% annualized, an annualized excess return of 13% over BND. During the last bear market (1/1/2008 to 5/1/2009), it would have returned 8.5% annualized, beating BND by 4.7% (with 2 ETF missing due to inception dates).
Possible holdings
The list of possible holdings is below. It may be revised depending on new ETFs and liquidity.
|
Name (ticker) |
|
Vanguard Total Bond Market ETF (BND) |
|
SPDR Bloomberg Barclays Convertible (CWB) |
|
iShares 7-10 Year Treasury Bond ETF (IEF) |
|
SPDR Bloomberg Barclays High Yield (JNK) |
|
iShares National Muni Bond ETF (MUB) |
|
iShares 1-3 Year Treasury Bond ETF (SHY) |
|
iShares 20 Plus Year Treasury Bond (TLT) |
|
SPDR Citi International Government (WIP) |
Like for all tactical allocation strategies, the number of possible holding is critical: having too many ETFs in the list brings a risk of performance whipsaw and additional transaction costs, having not enough brings a risk of missing trends in some asset sub-categories.
Conclusion
A tactical bond allocation, and more specifically, this Bond Rotation model, may be an interesting strategy for:
-
Bond investors trying to beat bond benchmarks.
-
Investors willing to keep a significant exposure in bonds, despite rising rates.
-
Investors following any kind of static stock/bond allocation (80/20, 60/40, 50/50…).
The model has now more than 5 years of out-of-sample life. Real performance in the recent (and short) post-QE period gives some clues that the model might continue outperforming its benchmark in a rising rate environment. Simulated performances during the 2008 crash and the 2009-2013 bull period show that the model was able to outperform its benchmark and provide positive returns in two different market regimes. However, past performance, real or simulated, is never a guarantee of future results.
Disclosure: I/we have no positions in any stocks mentioned, and no plans to initiate any positions within the next 72 hours. I wrote this article myself, and it expresses my own opinions. I am not receiving compensation for it (other than from Seeking Alpha). I have no business relationship with any company whose stock is mentioned in this article.
Additional disclosure: I had to stop following this model myself in 2018 after PRIIPS regulation enforcement on EU-based non-professional accounts. I may follow it again as soon as I find a good solution for my personal situation.
Be the first to comment