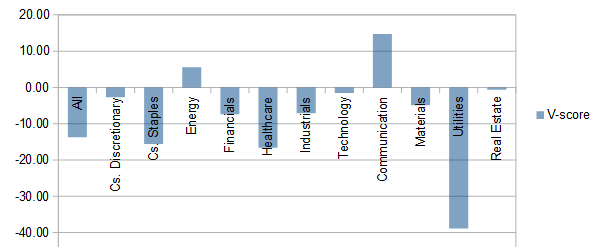
This monthly series gives fundamental scores by sector for companies in the S&P 500 index (SPY). I follow chosen fundamental factors for every sector and compare them to a historical baseline, so as to create a synthetic dashboard with a value score (V-score) and a quality score (Q-score). You can find here data that may be useful in a top-down approach.
GICS sectors have changed in 2016 (real estate), then in September 2018 (communication: read here). Historical averages of valuation ratios have been recalculated with the new sector structure. We compare current median ratios and their historical averages in the same logical sets of companies. Media companies have been excluded from the history of consumer discretionary and included in the history of communication. Internet and home entertainment software have been excluded from technology and included in communication.
Methodology
-
The median value of 4 valuation ratios is calculated for S&P 500 companies in each sector: Price/Earnings (P/E), Forward Price/Earnings for the current year (Fwd P/E), Price-to-Sales (P/S), Price-to-Free cash flow (P/FCF).
-
It is compared in percentage to its own historical average. For example, a difference of 10% means that the current median ratio is 10% over- or under-priced relative to its historical average in the sector.
-
The V-score of a sector is the average of differences in percentage for the 4 factors, multiplied by -1. The higher it is, the better.
-
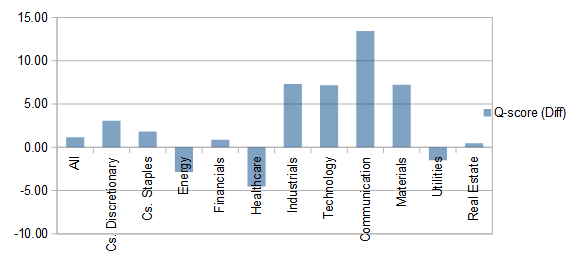
The Q-score is the difference between the current median ROE (return on equity) and its historical average. The higher it is, the better.
The choice of the valuation and quality ratios has been justified in previous articles. Among the simple, publicly available fundamental factors, they are the best predictors of future returns according to 17-year backtests. Median values are better reference data than averages for stock-picking. Each median is the middle point of a sector, which can be used to separate good and bad elements. A median is also less sensitive to outliers.
Sector valuation table on 1/6/2018
The next table reports the 4 valuation factors. There are 3 columns for each factor: the current median value, the historical average (“Avg”) between January 1999 and October 2015 taken as an arbitrary reference of fair valuation, and the difference in percentage (“%Hist”). The first column, “V-score”, shows the value score as defined above.
|
V-score |
P/E |
Avg |
%Hist |
Fwd P/E |
Avg |
%Hist |
P/S |
Avg |
%Hist |
P/FCF |
Avg |
%Hist |
|
|
All |
-13.70 |
19.00 |
19.18 |
-0.92 |
14.79 |
14.83 |
-0.30 |
2.33 |
1.58 |
47.57 |
26.79 |
24.7 |
8.47 |
|
Consumer Discretionary |
-2.70 |
17.14 |
18.15 |
-5.55 |
13.51 |
14.11 |
-4.28 |
1.24 |
1.01 |
22.29 |
23.98 |
24.38 |
-1.66 |
|
Consumer Staples |
-15.58 |
21.08 |
20.48 |
2.94 |
16.51 |
16.27 |
1.48 |
2.31 |
1.54 |
50.20 |
42.30 |
39.28 |
7.69 |
|
Energy |
5.53 |
12.62 |
17.8 |
-29.08 |
14.73 |
14.38 |
2.45 |
1.79 |
1.94 |
-7.87 |
34.37 |
30.59 |
12.37 |
|
Financials |
-7.36 |
11.99 |
15.02 |
-20.17 |
10.36 |
11.55 |
-10.27 |
2.31 |
1.89 |
21.96 |
13.84 |
10.03 |
37.94 |
|
Healthcare |
-16.62 |
34.22 |
23.76 |
44.04 |
16.22 |
16.85 |
-3.74 |
3.77 |
2.93 |
28.58 |
29.32 |
30.04 |
-2.41 |
|
Industrials |
-7.08 |
17.51 |
18.75 |
-6.61 |
14.27 |
14.52 |
-1.76 |
1.44 |
1.24 |
16.27 |
30.90 |
25.66 |
20.42 |
|
Technology |
-1.56 |
26.28 |
28.14 |
-6.63 |
15.82 |
19.29 |
-18.01 |
3.74 |
2.84 |
31.79 |
24.89 |
25.11 |
-0.89 |
|
Communication |
14.75 |
13.81 |
21.28 |
-35.12 |
15.50 |
17.09 |
-9.30 |
1.90 |
2.01 |
-5.29 |
23.86 |
26.31 |
-9.30 |
|
Materials |
-4.88 |
19.23 |
19.74 |
-2.61 |
13.69 |
14.36 |
-4.67 |
1.58 |
1.15 |
37.33 |
24.63 |
27.53 |
-10.54 |
|
Utilities |
-38.91 |
18.77 |
15.21 |
23.40 |
17.61 |
13.15 |
33.91 |
2.20 |
1.11 |
98.31 |
N/A |
43.5 |
N/A |
|
Real Estate |
-0.63 |
35.87 |
40.71 |
-11.90 |
41.24 |
36 |
14.56 |
7.43 |
6.67 |
11.42 |
45.82 |
51.8 |
-11.55 |
Energy: P/FCF Avg starts in 2000 – Utilities: P/FCF starts in 2004 – Real Estate: Avg start in 2006
V-score chart:
Sector quality table
The next table gives a score for each sector relative to its own historical average. Here, only one factor is accounted for.
|
Q-score (Diff) |
Median ROE |
Avg |
|
|
All |
1.16 |
16.09 |
14.93 |
|
Consumer Discretionary |
3.07 |
20.95 |
17.88 |
|
Consumer Staples |
1.82 |
25.88 |
24.06 |
|
Energy |
-2.86 |
12.03 |
14.89 |
|
Financials |
0.87 |
13.40 |
12.53 |
|
Healthcare |
-4.53 |
13.07 |
17.6 |
|
Industrials |
7.31 |
24.26 |
16.95 |
|
Technology |
7.17 |
20.92 |
13.75 |
|
Communication |
13.45 |
25.42 |
11.97 |
|
Materials |
7.23 |
21.12 |
13.89 |
|
Utilities |
-1.50 |
9.85 |
11.35 |
|
Real Estate |
0.48 |
7.31 |
6.83 |
Q-score chart:
Relative momentum
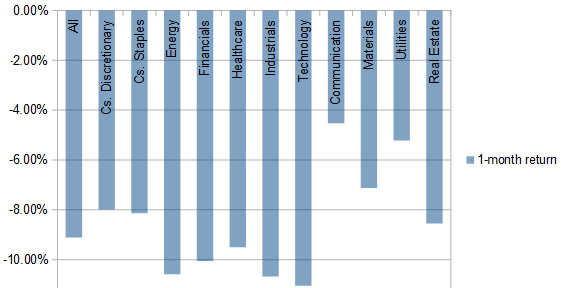
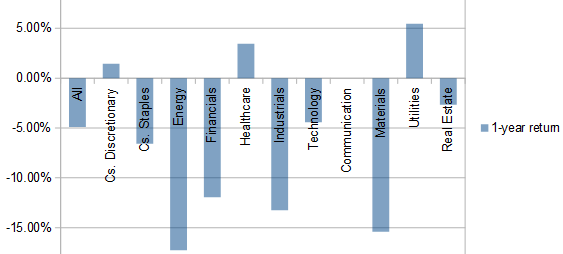
The next table and chart show the return in one month and one year for all sectors, represented by their respective SPDR ETFs (including dividends).
|
Sector |
ETF |
1-month return |
1-year return |
|
All |
-9.11% |
-4.91% |
|
|
Consumer Discretionary |
-7.99% |
1.43% |
|
|
Consumer Staples |
-8.14% |
-6.59% |
|
|
Energy |
-10.58% |
-17.25% |
|
|
Financials |
-10.05% |
-11.95% |
|
|
Healthcare |
-9.50% |
3.44% |
|
|
Industrials |
-10.67% |
-13.24% |
|
|
Technology |
-11.05% |
-4.43% |
|
|
Communication |
-4.53% |
N/A |
|
|
Materials |
-7.12% |
-15.40% |
|
|
Utilities |
-5.22% |
5.44% |
|
|
Real Estate |
-8.55% |
-2.68% |
Monthly Momentum:
Annual Momentum:
Interpretation
For median-based metrics, S&P 500 companies look overpriced by about 13.7%, with a quality score above the historical average.
Since last month:
- The S&P 500 went down 9.1%. It is close to where it was in October 2017, but at this time, the index was overpriced by 32% and had a quality below the historical average using the same metrics.
- The V-score has improved by 10 percentage points.
- The Q-score is stable.
- Looking only at the median P/E, S&P 500 companies are priced at the average of 2000 to 2015.
- All sectors are in loss. The largest loss was in technology, the smallest in communication.
- The V-score has improved in all sectors.
- Q-Score has improved in consumer discretionary, materials and is stable elsewhere.
- The 1-year momentum in technology and consumer discretionary is not consistent with sector index components after the GICS changes of September 2018. It will be progressively normalized to be consistent again in September 2019.
Communication is underpriced by almost 15%, energy by more than 5%. Real estate, technology and consumer discretionary are fairly priced. Financials, industrials and materials are overpriced by less than 10%; consumer staples and healthcare by less than 20%; utilities by almost 40%. Communication, technology, industrials and materials are significantly above their historical averages in quality metric. Healthcare is the worst performer in Q-score. Combining valuation and quality metrics, communication is the best sector and utilities the worst one. However, savvy investors may find opportunities in any sector. I think the systemic risk is more important than market valuation to manage a portfolio.
In the next weeks, I will write top-down articles with data at industry level for various sectors and stocks looking cheap in these sectors. All these “cheap stocks” together are the Dashboard List updated once a month for Quantitative Risk & Value members before a part is published in free-access articles.
Disclosure: I/we have no positions in any stocks mentioned, and no plans to initiate any positions within the next 72 hours. I wrote this article myself, and it expresses my own opinions. I am not receiving compensation for it (other than from Seeking Alpha). I have no business relationship with any company whose stock is mentioned in this article.
Additional disclosure: I am long in stocks, some of them in the S&P 500.
Be the first to comment