
The new year is upon us, bringing with it the prospect of continued stock volatility and what could become a lingering correction cycle. In anticipation, I remain committed to exploring investment strategies that may perform relatively well, even in a not-so-bullish market environment.
In December, I discussed the covered call (a.k.a. “buy-write”) approach to generating portfolio returns through dividend payments and option premiums. Back then, I identified Horizons NASDAQ 100 Covered Call Fund (QYLD) as one of the most compelling ETFs in this space, at least to the extent that I have explored the different alternatives in the market.
Credit: Innogy Venture Capital
One of the key reasons why I believe QYLD has performed well in the past few years is its tracking of the more erratic Nasdaq 100 index – compared to the better diversified S&P 500 (SPY), for example. I explained a few weeks ago that with higher volatility expectations come higher option prices, hence higher premium generated by the buy-write investor. Therefore, I think it is only fair to look at another Nasdaq 100-tracking, buy-write ETF that might rival QYLD in its ability to produce superior absolute and risk-adjusted performance.
The Nuveen Nasdaq 100 Dynamic Overwrite Fund (QQQX) crossed my radar this week. The manager describes the ETF as follows:
The Fund is designed to offer regular distributions through a strategy that seeks attractive total return with less volatility than the Nasdaq 100 Index by investing in an equity portfolio that seeks to substantially replicate the price movements of the Nasdaq 100 Index, as well as selling call options on 35%-75% of the notional value of the Fund’s equity portfolio (with a 55% long-term target) in an effort to enhance the Fund’s risk-adjusted returns.
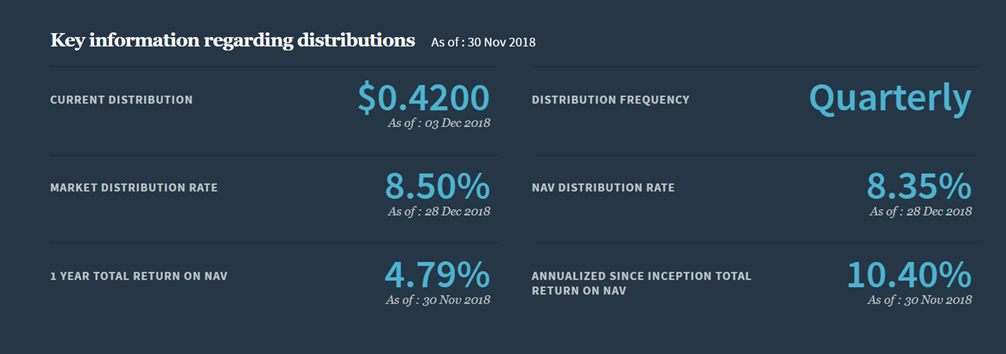
The dual objective of “seeking attractive returns” and generating “less volatility than the Nasdaq 100” seemed appealing to me. A quick glance at Nuveen’s performance provided by the management company (see figure below) further caught my attention: a historical annualized total return (i.e., appreciation on NAV plus dividend and option premium distribution) of 10.4%, even through a period that included all of the 2008 Great Recession, looked very encouraging. I usually do not expect a covered call ETF’s performance to reach the double digits, as seemed to be the case here.
Source: Nuveen’s ETF page
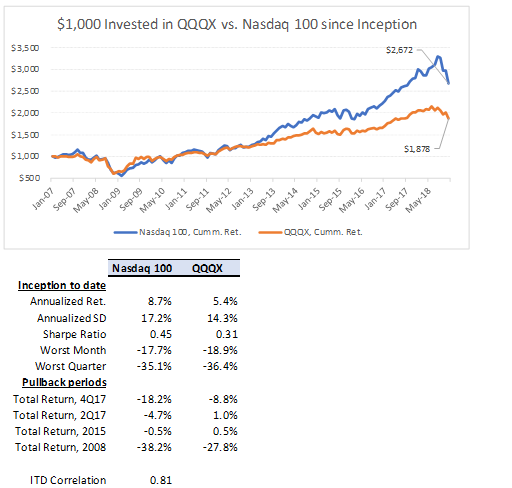
I then decided to simulate what a $1,000 portfolio invested in QQQX at its January 2007 inception would look like today compared to a similar investment in the Nasdaq 100 (QQQ). The result, surprisingly, was disappointing.
As the chart and table below suggest, the hypothetical QQQX portfolio would have been worth $1,878 today, about 12 years later, for a compounded annual return of only 5.4%. On the other hand, the Nasdaq 100 investment would have reached a much higher $2,672, for a compounded annual return that was a noticeable 330 bps better. Because buy-write strategies are meant to be more conservative than a plain investment in the stock index, the absolute under-performance of QQQX relative to the Nasdaq 100 was not a shocker. What looked much less inspiring to me was QQQX’s inferior risk-adjusted results: Sharpe ratio of 0.31 (assuming a risk-free rate of 1%) vs. the benchmark’s 0.45.
Source: DM Martins Research, using data from Yahoo Finance and Nuveen
A couple of key observations jumped at me:
- Nuveen’s apparent use of simple (i.e., non-compounded) arithmetic along with what seems like gross-of-fee performance in its calculation of 10.4% annualized returns can be very confusing, if not misleading. A quick “smell test” proves that this number looks inflated: if QQQX’s market value near inception was $20 apiece and shares ended 2018 trading at the exact same price, investors’ returns since 2007 must have come exclusively from the combined $17.59 in quarterly distributions ever made – a number that, against the original $20 price, couldn’t have produced 10% or more in annualized returns.
- Not evident in the graph and table above, one of the main factors potentially dragging QQQX’s performance since inception are the high management fees. The ETF charges investors a hefty 0.92% in annual fund expenses, as the table below depicts. Compared to what has been so far my favorite ETF in the buy-write space (QYLD), the extra 30 bps in costs can certainly add up over time. In fact, on a gross-of-fee-basis, I estimate that QQQX’s risk-adjusted under-performance against the Nasdaq 100 narrows to about half what it has been since inception.
 Source: Nuveen’s ETF page
In conclusion
My attempt to find a strong alternative to QYLD in the covered call ETF arena has fallen short of its intended goal. QQQX does not look very compelling to me judging by the fund’s (1) historical performance against the Nasdaq 100 benchmark and (2) higher-than-average management fees.
Yet, I continue to believe that the quest for producing better risk-adjusted performance, particularly during a period of high volatility in the markets, is one worth pursuing.
I attempt to achieve the goal of generating market-like returns with lower risk alongside my Storm-Resistant Growth premium community on Seeking Alpha. In the early part of 2019, I will launch my custom-made buy-write portfolio, called “The 10% Yielder”, as part of this service. I will present and debate a list of stocks that could provide investors with a hefty and periodic inflow of cash through dividends and call option premiums. To become a member of this community at 2018 prices and further explore these investment opportunities, click on this link and take advantage of the 14-day free trial today.
Disclosure: I/we have no positions in any stocks mentioned, and no plans to initiate any positions within the next 72 hours. I wrote this article myself, and it expresses my own opinions. I am not receiving compensation for it (other than from Seeking Alpha). I have no business relationship with any company whose stock is mentioned in this article.
Be the first to comment