“It’s fine to celebrate success, but it is more important to heed the lessons of failure.” – Bill Gates
“Celebrate your successes. Find some humor in your failures.” – Sam Walton
It’s almost over! With just one trading day to go in 2018, this end of the year selling stampede won’t be missed. Before I get into more details about 2018, please do NOT lose sight of the fact that because we turn the page on the calendar, it doesn’t necessarily mean this market environment will change with it.
Anyone that is or was bullish would have liked to see the year end three short months ago. The S&P 500 rallied to a new high up nearly 10% for the year, all major indices had already posted new highs, and a DOW theory BUY signal was flashed.
Since then, stocks literally fell off a cliff. Investors couldn’t sell stocks fast enough. They became fearful of what they saw around them. Washington is a mess and getting messier, the media says there is little to no resolution to the US-China trade war, and by most economists’ views, the economy is slowing. Add in the complete mistrust now for the chair of the Federal Reserve, and you have the making of a “perfect” storm to kick off a selling stampede.
I will add one more point that no one is talking about. It is left out of conversations because it contains no drama. The fact that the S&P has had an extraordinary run since the lows of 2016. Oh and let us all not forget how the Nasdaq and the Russell made those gains look small as they both outperformed the S&P by a wide margin. Geez, that seems like years ago. Market participants have very short memories. In my view, reversion to the mean is a KEY reason we are in this malaise now.
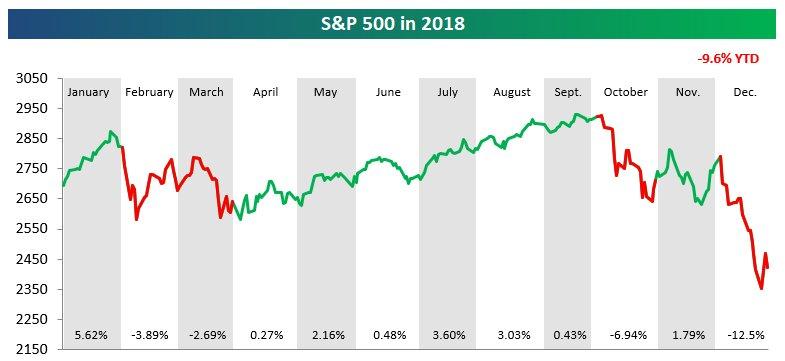
Investors can pick their reason du jour for the declines, they surely have a lot to choose from. It matters little what you or I believe, because the situation exists and we cannot control the external influences that affect the markets. We will get back to the volatile last quarter of the year, but let’s not forget to look at the year in its entirety. A time period that brought confusion to a lot of seasoned stock market professionals. The chart below shows the S&P 500’s price movements throughout the year. Months that finished positive have green highlighting, while down months have red highlighting.
Source: Bespoke
A new high for the S&P in January, followed by a swift 12% decline to the intraday lows. A drop that had many proclaiming the bull market is over. Consolidation and stabilization, then a run back to a new all-time high, and all looked fine. ALL major indices were involved as they too made new highs before the S&P. The Dow 30 then confirmed the move with a Dow Theory BUY signal in September. ALL of those similar signals had provided me with an ALL CLEAR on so many previous occasions in this Bull market. However, this time around, it was different, and I was completely fooled.
This December will go down as the worst month of 2018, which would make it the first time December has ever been a year’s worst month. As if that wasn’t bad enough, December is also on pace to be the worst month for U.S. stocks since October 2008 and the worst December for the stock market since 1931. The market action also produced a Dow Theory SELL signal. We do have to wonder if the situation is really that bad.

Investors also have to realize the issues don’t have to look terrible to warrant a change in direction, and in this case, the result is a sell-off of significant proportions. The stock market cares little about ABSOLUTES, it cares about CHANGE, change in either direction. When it believes a change is about to take place, it too changes. Back in the days when all didn’t look so rosy, change is why the market rallied. Back then, the market saw a change for the positive from the deep dark days of the financial crisis and rallied hard.
Today, while there is no shortage of issues to worry about, the market has sniffed out what it believes to be a change. Ahhh, but nothing is ever black and white when it comes to investing. Just like I was fooled at the latest market highs, so too were many fooled back in 2016. Back then, the signals were there, but the real change that was anticipated never materialized.
We have learned it hardly pays to fight the message the market is putting forth. After all that is what I have believed and preached here for years now. However, there are quite a few different ways to interpret the message and then finally act on it, and it all requires PATIENCE. I also believe that when the time comes, an investor needs to act, but not overreact.

Looking at ALL of the data that makes up the entire market backdrop, it appears there could be another case of market FEAR regarding situations that may never take place. It is simple reality now that we are NOT looking at conditions that would warrant a roaring rally in equities, but they’re not representative of a massive recession either.
As far as the economic cycle is concerned, sure we are in the late stages. If the expansion runs through the second quarter of 2019, it will be the longest ever. While economic activity may be slowing, leading indicators that track recession, like the yield curve and the ratio of leading to coincident indicators, are far from rolling over at this point. That’s not to say that everything is humming along.
2018 brought a slowdown in the housing sector and a stall in auto sales, but they too haven’t completely rolled over at this point. Housing data has weakened as a result of tax policy and higher rates. That weakness might be a temporary pause versus the beginning of a deep and prolonged downtrend. Last month’s data showed a slight uptick in results.
Unlike the economic expansion, it is said the great bull market of the last 9+ years looks like it’s over, as both the Russell 2000 and Nasdaq led the way into bear market territory. The S&P 500 (-19.8%) and the Dow 30 (-18.8%) did manage to fall just short of the 20% threshold. What has been unique about this period though is that unlike prior bull markets, if September 20th was in fact the peak, the bull market didn’t end with nearly the same gusto as prior bull markets. As you saw earlier, the S&P rallied in eight months and fell in four, but the down months ended up leaving the index down 7% YTD with just one trading day left in the year. Market participants realize it has been worse than that.
In 2018, there have been 18 trading days where the index moved up or down more than 2%. Confusing whipsaw action makes it a very difficult market to navigate. Every investment period cannot be easy. 2018 brought about a transition in more ways than one. Investors had an easy time of it in 2017, no significant draw-downs and record low volatility. 2018 was far different.
After big gains on the S&P of 10% and 20% over the prior two years, and 13% and 25% gains for the DJIA, we now get a breather in 2018. So while the questions fly around, is it the Fed? Is it the trade war? Is it the dysfunction in D.C.? Could it be all of the above? This year’s decline is only the second annual decline for the Dow since 2008 and the largest in percentage terms. That is what a secular bull market looks like.
I will let the others keep searching for the answers to explain what has happened in the last three months of the year. Perhaps it is what has occurred since markets have been in existence, and what markets have done time and time again. A simple reversion to the mean where the markets work off a 30% gain in the last two years. I believe there is still a very good chance that is THE answer, as the issues that ALL are talking about are window dressing. Keeping things in perspective, and that usually doesn’t mean the end of the financial world as we know it.

Economy
The retail season finished on an uptick as Holiday sales were stronger this year topping 2017 sales.

Chicago Fed National Activity Index rose to 0.22 in November after a neutral reading in October.
December Richmond Fed index plunge to -8.0 from 14.0, leaving the lowest reading since a -10.0 figure in February of 2016 that coincided with the bottom for the last big round of oil price declines. Analysts saw the same -8.0 reading in June of 2016.
Chicago PMI eased to 65.4 in December, down 1.0 point from November’s 66.4. This reading is coming off an 8 point rise in November. The current reading for the index is actually higher than 95% of readings since 1990.

Mastercard SpendingPulse reports that U.S. holiday sales from November 1 through December 24 increased 5.1% to more than $850B this year, calling this “the strongest growth in the last six years.” Online shopping also saw gains of 19.1% compared to 2017, according to Mastercard (NYSE:MA) SpendingPulse, which reports on national retail sales across all payment types based on aggregate sales activity in the Mastercard payments network, coupled with survey-based estimates for certain other payment forms, such as cash and check.
U.S. consumer confidence drops to 128.1 in December, after dropping 1.5 points to 136.4 in November (revised from 135.7), and is at a 5-month low. D.C dysfunction takes its toll.
Weekly Bloomberg consumer comfort data showed very little retreat from the multi-year high tagged in the last week of September.

Pending home sales index declined 0.7% to 101.4 in November, weaker than expected, and extending the 2.6% drop to 102.1 in October. The index was at 109.8 a year ago Lawrence Yun, NAR chief economist:
“The current sales numbers don’t fully take into account other data. The latest decline in contract signings implies more short-term pullback in the housing sector and does not yet capture the impact of recent favorable conditions of mortgage rates.”
“While pending contracts have reached their lowest mark since 2014, there is no reason to be overly concerned, and he predicts solid growth potential for the long-term.”

Earnings Observations
When the SP 500 peaked in late September ’18, the forward 4 quarter estimate was $168.72; today, that same estimate is $169.58. The point is with the S&P 500 index falling some 15%, the forward estimate on which it’s valued is actually slightly higher. The question is will these estimates hold. Clearly the stock market is not so sure.
With the selling stampede pushing stock prices lower, investors are now pricing in zero growth in earnings for 2019. 2018 earnings will come in at around $162 for the year. Clearly, the market has lost a tremendous amount of confidence in the staying power of earnings and the health of the economy. If we apply a conservative 14-15 multiple to that, it yields a range for the S&P at 2,268-2,430. So with the index closing at 2,488 today, we are just above that range. Here is the rub, the stock market likes to overshoot in either direction when it sees change. Emotion takes over and causes that to occur.
Not everything is bad. One thing that has also changed is the market’s valuation. It’s been some time since this could be said, but the S&P 500 is actually heading into 2019 with a P/E ratio right in line with its historical average going back to 1929. And if you look just at the last 30 years going back to 1990, it is actually undervalued.
The Political Scene
There is a total lack of confidence in our government. Investors can expect more noise and more concerns, and the D.C. situation is only going to get worse as the Democrats take the House. The question isn’t whether the news is bad and can get worse, the question is when it is discounted in the market.

Investors are concerned that they see no progress on the trade front with China. This headline that was dismissed on Monday would indicate otherwise as China has lowered some tariffs. Then along came a headline that China was allowing rice imports for the first time ever from the U.S. Things may not be rosy, but the present negative mindset is way overdone.

The Fed
ALL eyes turned to the Fed this year as it took the spotlight during the last three months of 2018. The conversation raged on before and after the latest rate increase, debating when the FOMC will stop raising rates. Chair Powell said he expects to see two more hikes next year, but the market isn’t so sure. There is a reason for that doubt. Based on history, the Fed is a follower, not a leader, of markets and the economy. Taking the other side of that argument, it may be best not to jump to any conclusions.
Change for the better, change for the worse is all the market cares about. So let’s put the topic of Quantitative Easing and Quantitative Tightening in perspective. No opinion, no obsession, and no predictions on what may or may not occur. All of that is wasted energy because an investor has no control over that situation.
We played the QE cards, we didn’t obsess, complain, or offer opinions. Now if the trend has indeed changed, we play the QT cards. We don’t obsess, complain and offer opinions, because in doing so an investor gets distracted leading to huge mistakes. Just ask anyone who sat out the early stages of the Bull market because they saw the Fed actions as a huge negative.
It is pretty amazing how QT is the talk of the day. After all, this isn’t a surprise, it is not a bolt of lightning out of the sky. The program was broadcast long before the policy was implemented. The conclusion now becomes, if we believe QE added liquidity, then QT HAS to take it away. OK, but to what degree? Did anyone ever quantify how much the added liquidity boosted asset prices? Exactly how much was added to McDonald’s (NYSE:MCD) bottom line during QE?
At the moment there are no signs of a liquidity issue that would warrant anyone to get up and take notice. Exactly how much will McDonalds bottom line be hurt now with QT in place? If anyone has those answers please share their findings with investors. Could this be a real issue down the road? That is anyone’s guess. I suggest plenty of other factors that can affect the expected outcome of QT may appear as we travel that road.

Sentiment
Sentiment never spiked to any exuberant reading during the calendar year. The closest we came to excessive optimism was the January parabolic spike in stock prices as the new year started. We close the year with plenty of negativity all around us. From Sentiment Trader:
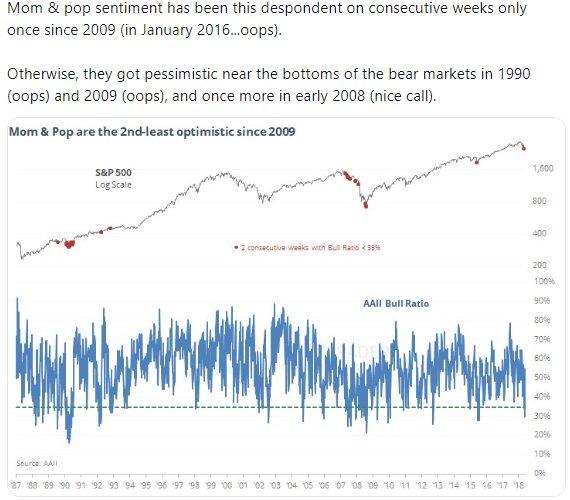
Unless one sees another financial crisis upon us, the probability is high that this could also mark a near term low.
Bullish sentiment as measured by the AAII survey of individual investors actually rose for the second week in a row to 31.6%. That is up from the very low 24.9% reading from last week, and an even lower reading of 20.9% in the prior week. With the market selling off, it comes as no surprise that bearish sentiment jumped to just above 50%, completely overtaking last week’s small downtick. Bearish sentiment has remained at elevated levels for some time now, but the last time investors were this pessimistic was back in April 2013. March of 2013 marked the S&P breakout from a multi-year trading range, and kicked off the secular Bull market.

Crude Oil
The EIA weekly inventory report showed inventories were unchanged for the week. At 441.5 million barrels, U.S. crude oil inventories remain about 7%, above the five-year average for this time of year. Total motor gasoline inventories increased by 3 million barrels last week and are about 4% above the five-year average for this time of year.
Crude oil remains below the $50 level. What was once support now becomes resistance. WTI closed the week at $45.29, down $0.11.

The Technical Picture
Trying to track the short-term waves during this downtrend has been a nightmare. Huge intraday swings have been the norm. All major indices have wiped out their entire 2018 gains in just two months.
There is a reason I noted a 19.8% decline in the bullet points instead of rounding up to 20%. It is splitting hairs, BUT official Bear market territory is considered a 20+% decline that was preceded by a 20%+ rally, all occurring on a closing basis. That does not mean I am minimizing the damage that has been done. For sure we have seen bear market type of activity, but if those lows (S&P 2,351) hold, the Bull market has not “officially” ended.
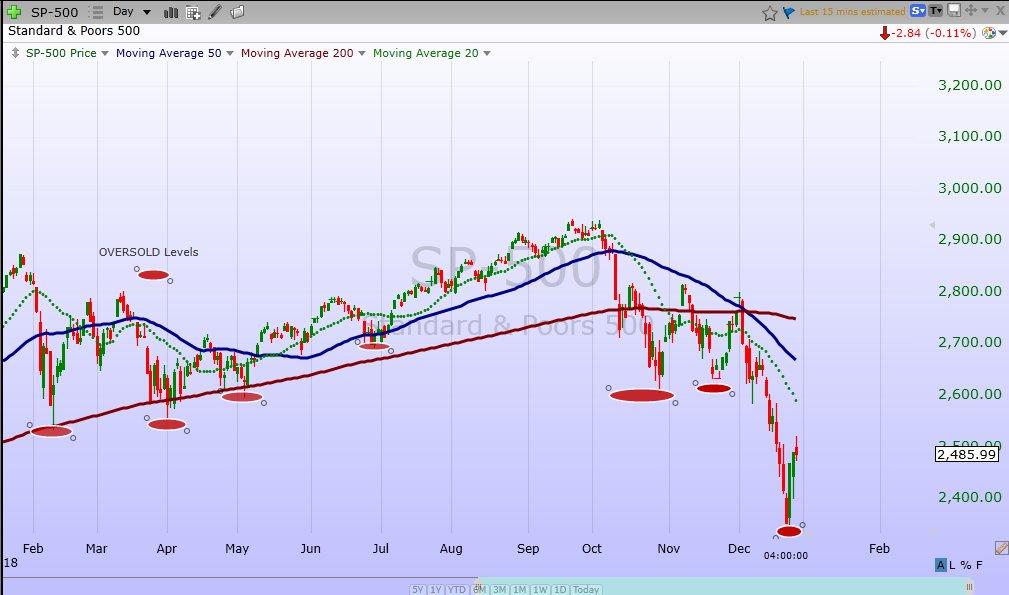
Chart courtesy of FreeStockCharts.com
The bottoming process in here. Until proven otherwise, the concept of “what once acted as support” may now act as “resistance” applies. Look at the chart above and you can see those last two oversold levels that once acted as support will now be major resistance (2,600 range). Expect the volatility to continue. Look for clues in the attempt for the S&P to come back from the severe drop. The Bulls want to see a series of “higher” lows to confirm positive market action.
Short-term support is at the 2,346 pivot, with initial resistance at 2,531.

Individual Stocks and Sectors
These two twitter posts give us an idea of how investors feel about Energy and Financial stocks now.
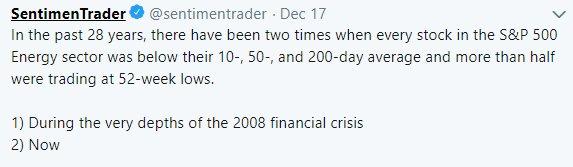


The up and down wild gyrations remain in place. After the worst Christmas Eve performance for the U.S. equity market in history, we now have witnessed the best post Christmas Day rally ever as well. At the lows, the S&P 500 was down 19.78% from its closing high on September 20, 2018, which puts it just 0.28% away from entering official bear market territory.
The average stock is down much more than that, and the breadth during the selling stampede has been terrible, so by no means am I downplaying the existing negative situation. The current stock market backdrop is actually quite similar to late 2015 and early 2016. So I come away with a sensation of “I’ve been here before”.

The similarities between now and then are remarkable: The 2016 drawdown successfully tested the 50 MONTH support line, and so has this pullback. At the lows the S&P in 2016 was 10.6% below the 20-month moving average. The decline this year took the S&P 11% below that demarcation line. A December Fed tightening and the prospect of a delay to further hikes against a backdrop of risk-asset volatility; uncertainty in global growth, especially Chinese growth, oil prices plummeting; and an S&P correction. Oh, and Brexit, which looms ever nearer in March next year. All the same as back then.
The Bulls would like to see the parallels of these two periods continue, because the earlier episode in 2015-16 did not lead to a recession. Nor did it lead to a crippling bear market. There is a very good chance that could be the case again. It is difficult to print back-to-back quarters of negative GDP growth with an economy at full employment and fiscal stimulus still in the pipeline. Despite the consensus view of a recession at our doorstep, it is still too early to tell. 2018 will be closed out and investors will have to wait and see. There are negatives for sure, but when we look at ALL of the data, there are many positives as well. Let the story play out.

Last week’s missive explained where we are regarding the overall equity market situation. Unless one brings emotion, bias, speculation, and conjecture into the picture, it is clear that the question of whether we see a replay of 2000, 2008 or 2016 remains unanswered. Well, that is as far as I am concerned, others have already made their decisions.
While we watch equities move rapidly and violently in one direction in a very short period of time, it is easy to get wrapped up in emotion. Plenty of market participants lose sight of what is really going on. That tends to get many to make a lot of assumptions and start guessing, that is their prerogative. As we have seen before the market situations can and will unfold differently. Nothing is SET in stone; the markets are always a very fluid situation.
It is why I continue to believe it is best not to jump to conclusions. Nor is it wise to start making long-term predictions that the S&P drops to a certain level, then goes to higher levels, only to drop to new lows and stay there for a long period of time. I will be the first one to tell readers I don’t have that ability. The next thing I will tell readers is that no one has that ability. It is simple; far too many things can occur to upset that cart.
If 2018 hasn’t convinced investors that it is best to play the situation as it unfolds, then they may never be convinced. Anyone looking for an exact black and white plan on how to proceed in this or any other market environment is going to be greatly disappointed. No such blueprint exists. Templates yes, guidelines yes, but there is no “perfect” strategy. I continue to stay the course until the questions that 2018 have brought to light are answered.
Happy, Healthy, Safe and Prosperous New Year to all!


I would also like to take a moment and remind all of the readers of an important issue. In these types of forums, readers bring a host of situations and variables to the table when visiting these articles. Therefore, it is impossible to pinpoint what may be right for each situation. Please keep that in mind when forming your investment strategy.
 to all of the readers that contribute to this forum to make these articles a better experience for everyone.
Best of Luck to All!
Disclaimer: My portfolios are ALL positioned to take advantage of the bull market with NO hedges in place.
This article contains my views of the equity market, it reflects the strategy and positioning that is comfortable for me. Of course, it is not suited for everyone, as there are far too many variables. Hopefully it sparks ideas, adds some common sense to the intricate investing process, and makes investors feel more calm, putting them in control.
The opinions rendered here, are just that – opinions – and along with positions can change at any time.
As always I encourage readers to use common sense when it comes to managing any ideas that I decide to share with the community. Nowhere is it implied that any stock should be bought and put away until you die. Periodic reviews are mandatory to adjust to changes in the macro backdrop that will take place over time.
Learn to use the FEAR of others to your advantage. It is time to take advantage of the quick snap back in the market. This is not the time to navigate the markets alone. Invest without emotion, drown out the noise and start profiting from what this stock market is giving investors. The Savvy Investor Marketplace service is here to help. Use the techniques that have proven successful in the past. Please consider joining one of the most successful new ventures here on Seeking Alpha.
Disclosure: I am/we are long EVERY STOCK IN THE SAVVY INVETMENT PORTFOLIOS. I wrote this article myself, and it expresses my own opinions. I am not receiving compensation for it (other than from Seeking Alpha). I have no business relationship with any company whose stock is mentioned in this article.
Be the first to comment