
Real Estate Weekly Review
US equity and bond markets stabilized this week following several weeks of intense volatility fueled by the sudden jump in interest rates, mixed economic data, and continued geopolitical concerns. The S&P 500 (SPY) finished the week modestly higher, bouncing back after last week’s 4% decline and climbing back within 5% of all-time highs.
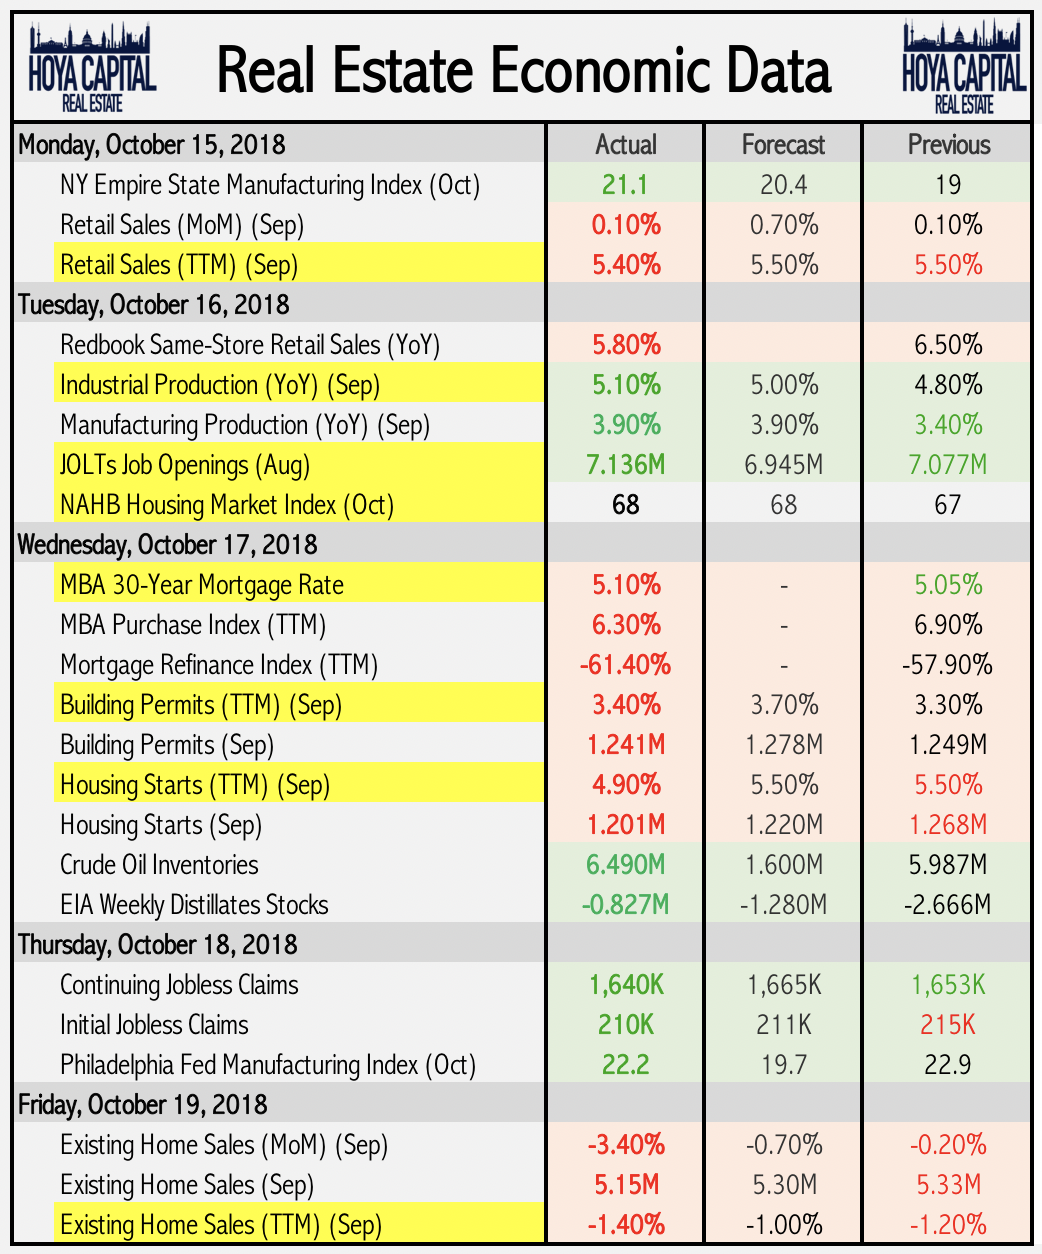
Defensive and yield-oriented sectors were the winners this week, led by REITs (VNQ and IYR) which surged more than 3% on the week following a cumulative 6% decline in the previous two weeks. Homebuilders (XHB and ITB) continue to be hammered by signs of softness in the single family housing markets. Housing starts, permits, and existing home sales data all missed estimates in September as the single family markets experience headwinds from higher mortgage rates and the effects of tax reform.
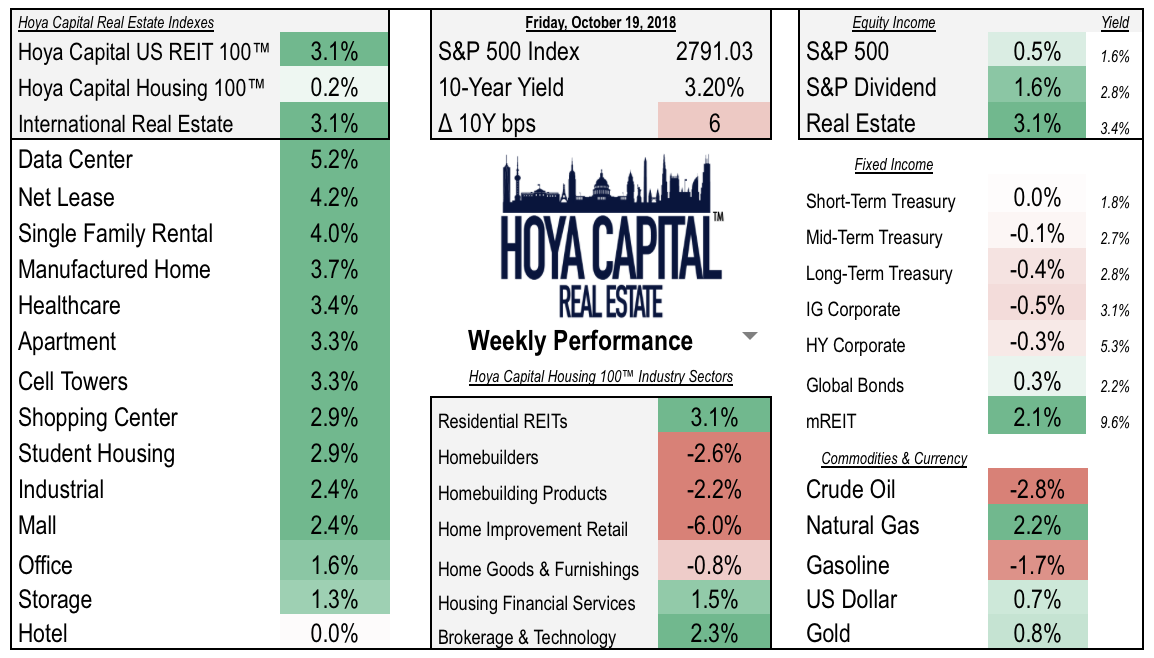
(Hoya Capital Real Estate, Performance as of 2pm Friday)
The Housing 100, a broad measure of the US housing market, finished the week flat as strength in the residential REIT and brokerage and IT sectors offset continued weakness in the single family housing-focused sectors. The previously high-flying home improvement retailers Home Depot (HD) and Lowe’s (LOW) each dipped more than 5% on the week as more analysts turn bearish on the housing sector. Homebuilders and homebuilding products each dipped another 2% this week, extending their 2018 losses following relatively weak results from NVR (NVR) and PPG (PPG).
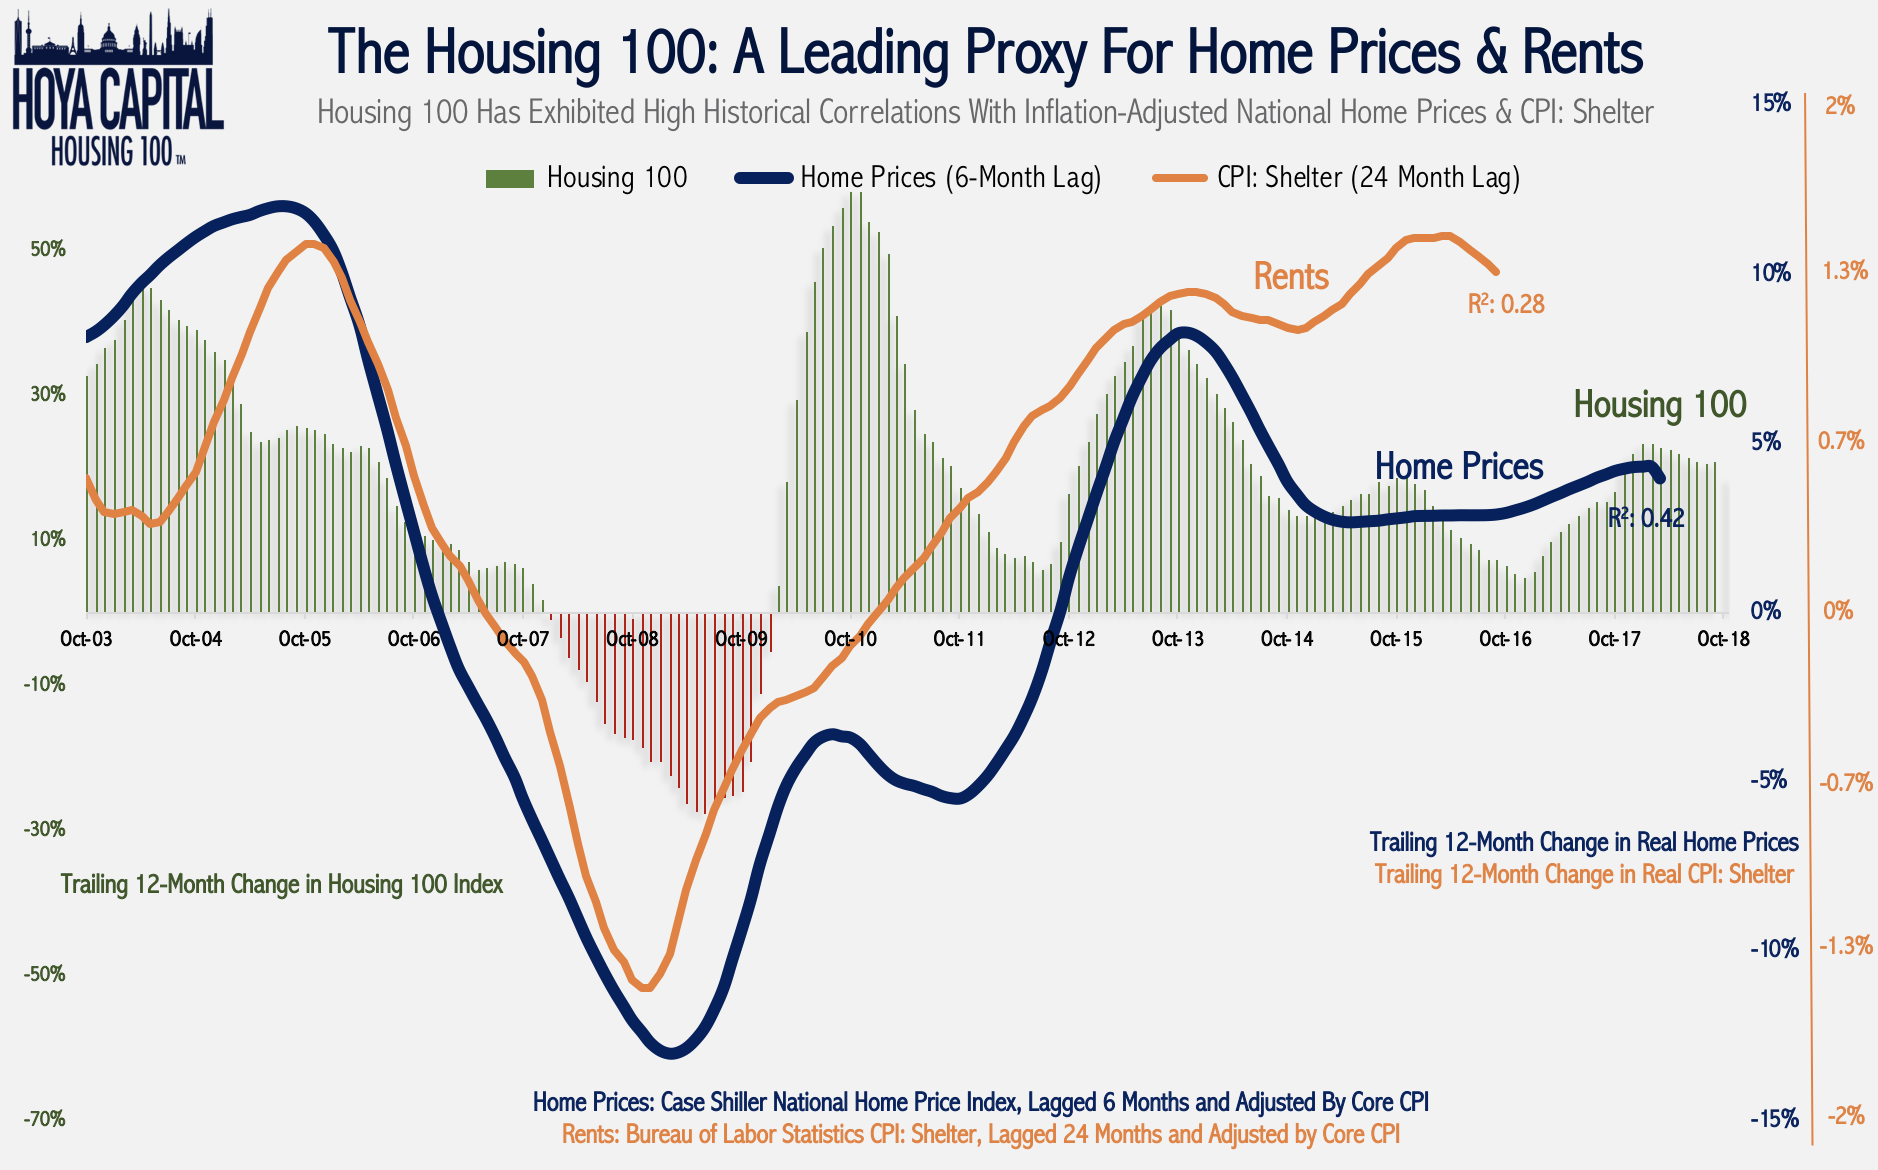
The Housing 100 has dipped more than 10% over the last month after breaching new record highs during the summer, reflecting the rapidly changing sentiment surrounding single family housing markets. So far, weakness in single family demand appears to be largely offset by strength in rental markets. We continue to believe it is far too early to call a top in the slow but persistent post-recession housing recovery given the period of persistent underbuilding over the last decade.
Real Estate Economic Data
(Hoya Capital Real Estate, HousingWire)
Weak Housing Data Continues, Sentiment Turns Sour
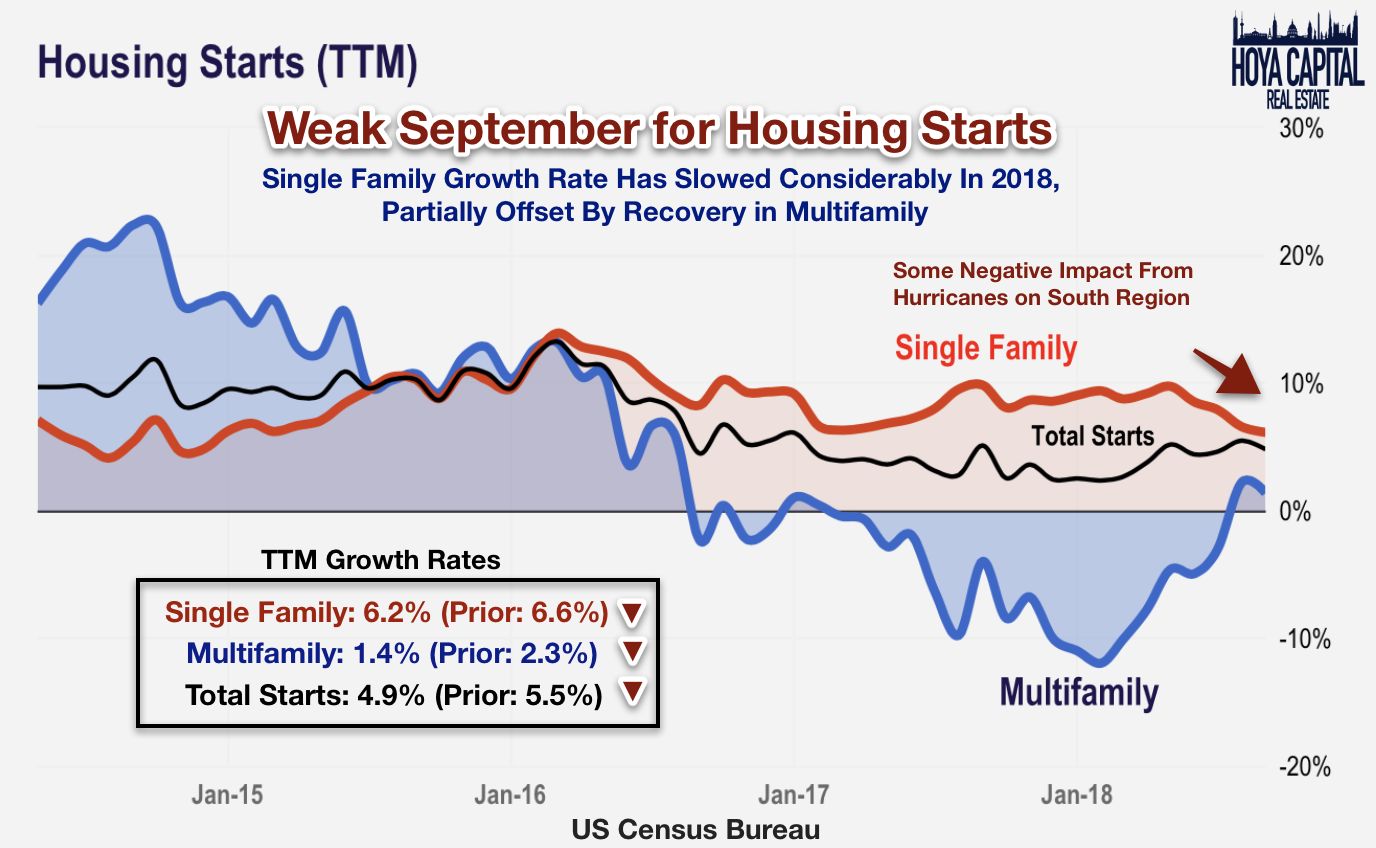
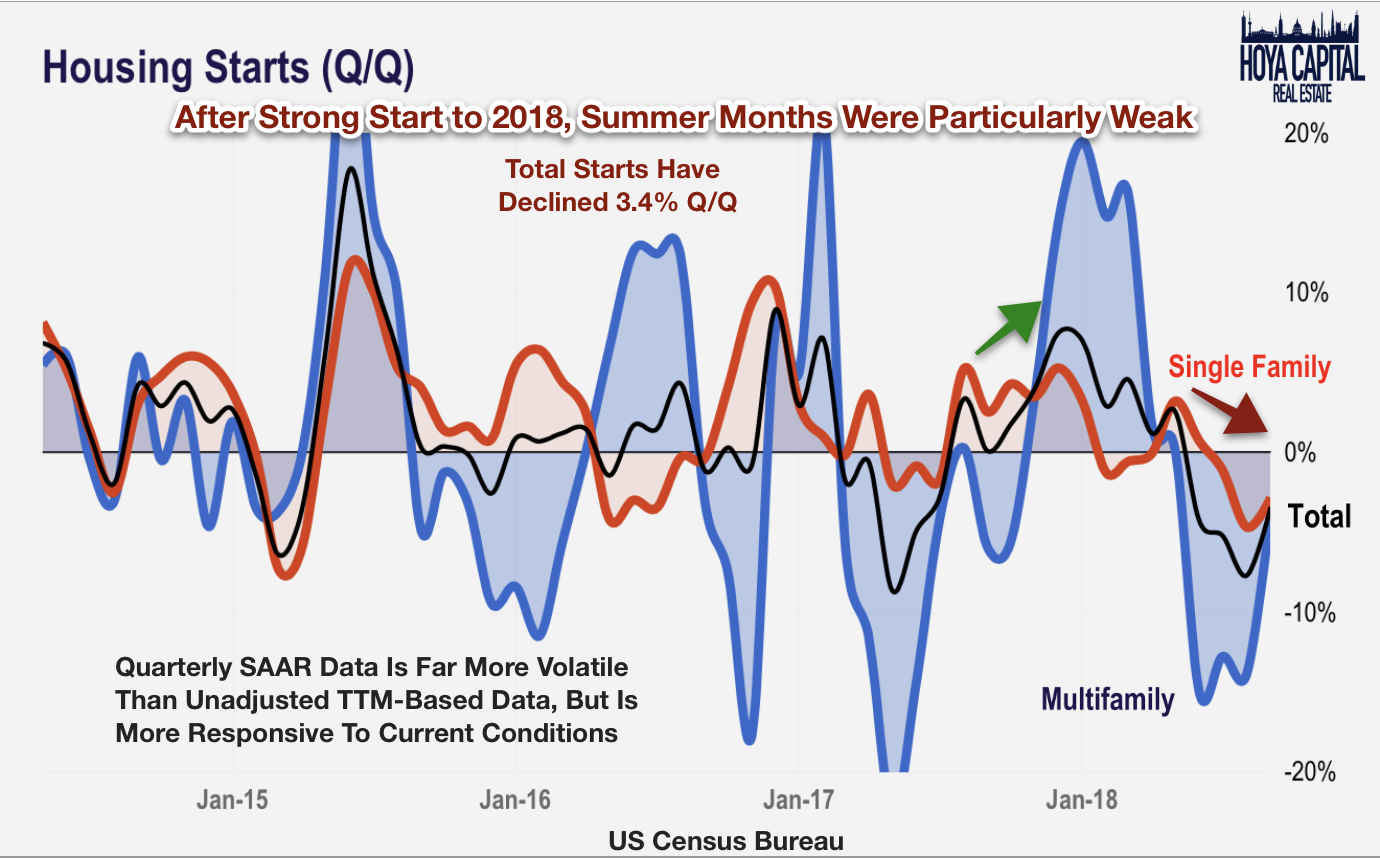
The choppy summer for housing data continued into September with a negative read on starts and permits. Total housing starts ticked lower to 4.9% on a TTM basis, continuing a downtrend that began in late-Spring after a strong start to 2018. The TTM growth rate for single family starts fell to 6.2%, the slowest rate of growth since 2015. Multifamily starts have risen a meager 1.4% over the last year, climbing out of a year-long decline following robust multifamily building activity between 2014 and 2017.
The picture isn’t much brighter when viewed through the lenses of housing permits. Total permits are higher by just 3.4% over the last twelve months and are lower by 4% over the last quarter. While we generally avoid putting too much weight on the volatile monthly seasonally-adjusted-based data, the weakness over the last four months is clearly more significant than the typical noisy fluctuations that are common in this data set. On a quarter-over-quarter basis, starts have declined more than -3%.
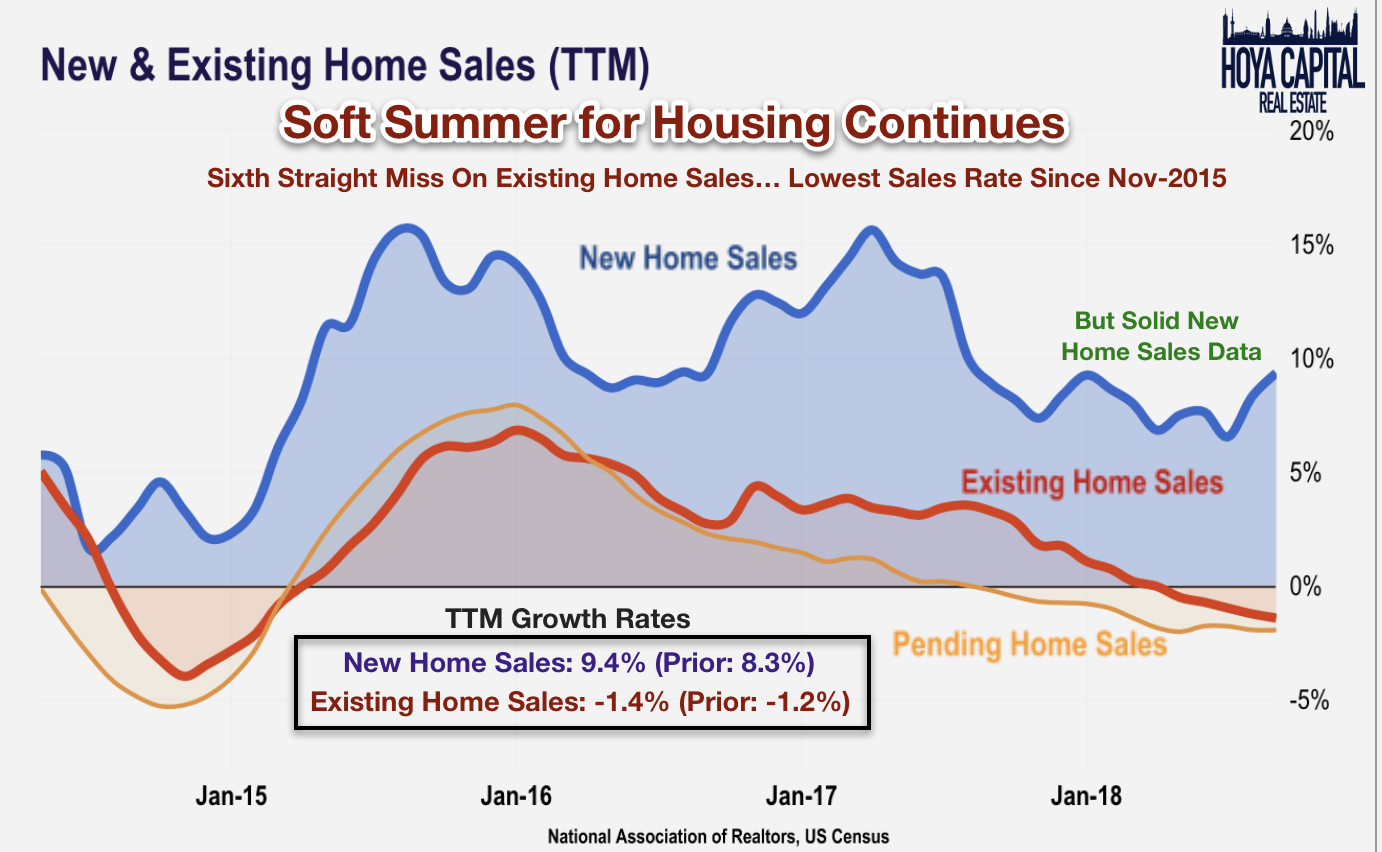
Consistent with the trends in the starts and permitting data, new and existing home sales data has been similarly choppy. This week, existing home sales data missed estimates for the sixth straight month, dipping to the lowest rate since late 2015. Last week, new home sales data slightly missed expectations for the third consecutive month. While robust economic growth and rising consumer confidence normally translate into rising home sales, single family sellers face headwinds, including rising mortgage rates, affordability challenges, changes to the tax code that weaken homeownership incentives, and strong competition from the luxury rental markets.
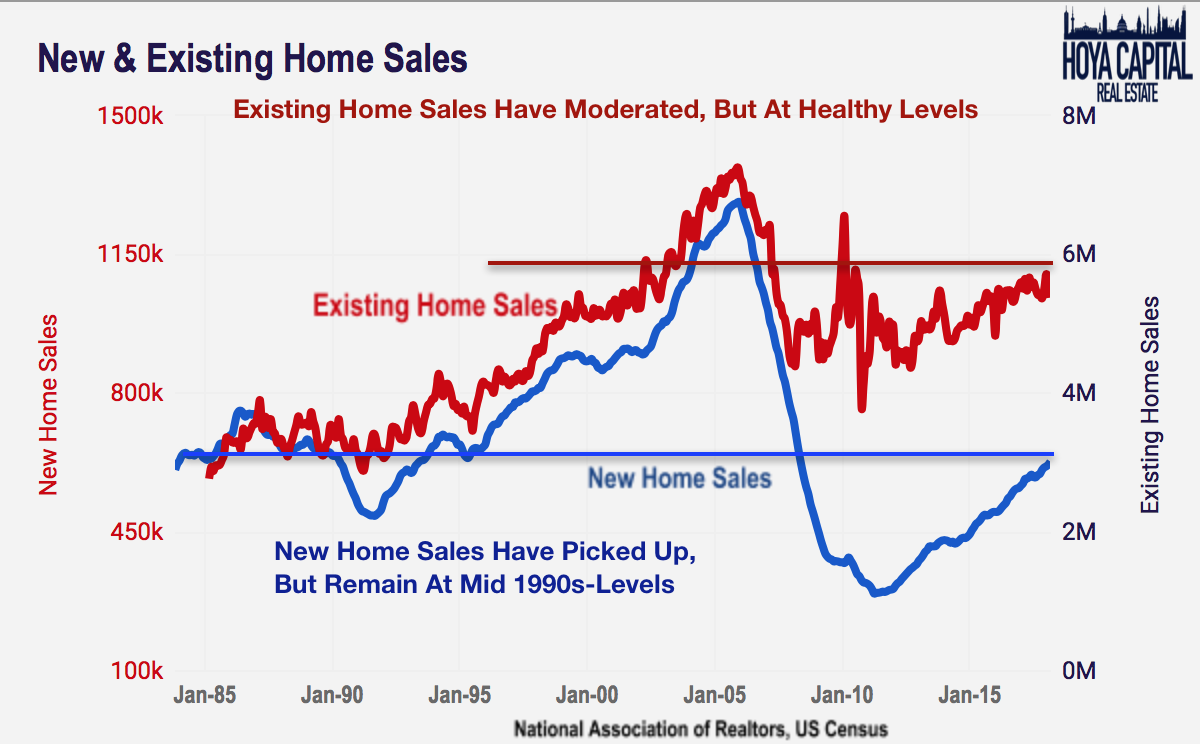
We continue to reiterate that weak trends in existing home sales are not necessarily a cause for alarm at this point. By historical standards, new home sales remain at mid-1990s levels and even lower after adjusting for population growth. The growth in existing home sales have slowed since 2015, but this rate remains healthy by historical standards. Too many existing home sales (as we saw from 2003-2006) indicate that either mortgage standards have gotten overly loose or short-term housing flipping activity has increased. At around 7% per year, the turnover rate of existing homes is roughly in line with pre-2000 levels. New home sales remains the key indicator to watch to accurately gauge the overall health of the single family housing industry.
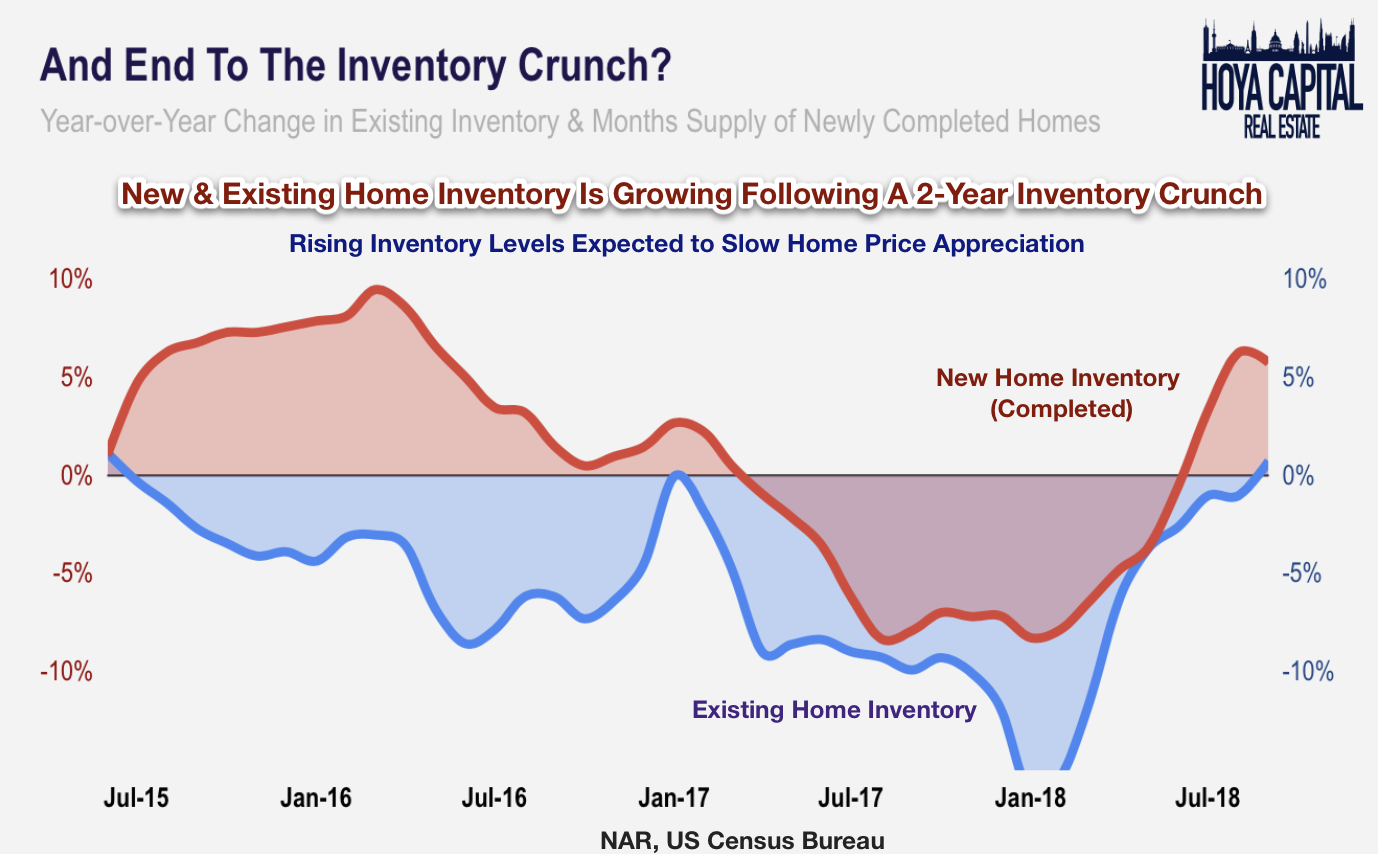
Of note over the last several months, however, is that new and existing home inventory is no longer receding, turning positive on a year-over-year basis for the first time since May 2015. The tight supply of existing homes has been blamed for moderate home sales activity and there is hope that a slight loosening of conditions may lead to increased transaction activity. Looser conditions in the single family markets are also expected to slow the pace of home price appreciation, which has risen at more than double the rate of inflation since 2012.
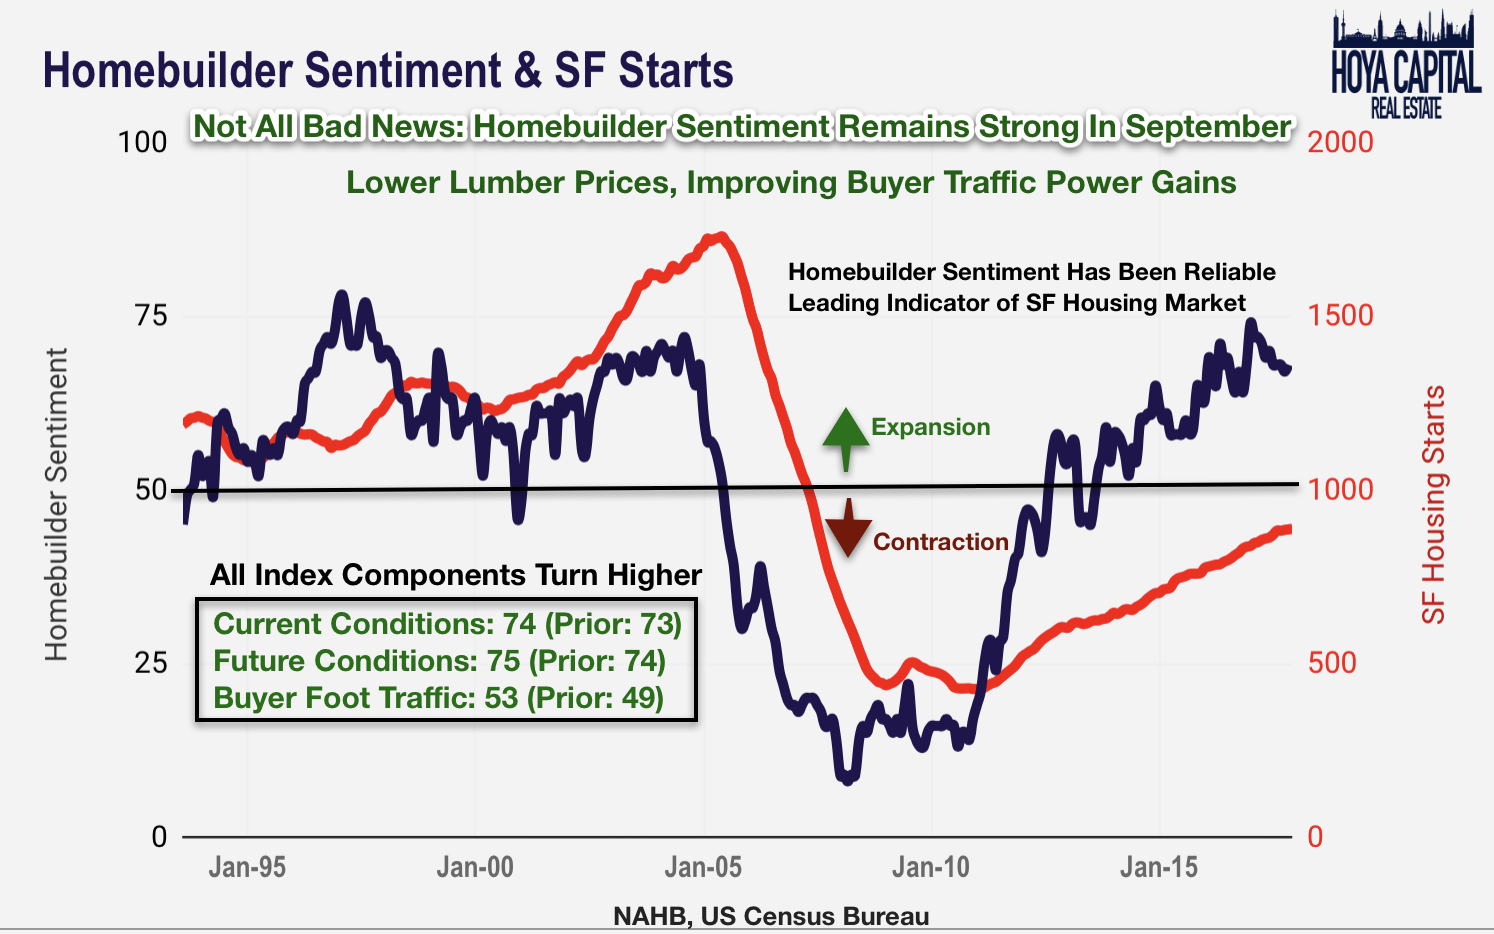
Not all housing data has been soft, however. This week’s NAHB Homebuilder sentiment data reading of 68 was an improvement over last month’s 67 reading. All three index components turned higher from last month as the recent plunge in lumber prices and the overall moderation in construction costs over the summer months remove one of the primary headwinds to new development. Historically, homebuilder sentiment has been a fairly reliable leading indicator of the single family housing market: the HMI index turned sharply lower beginning in 2004, long before broader conditions in the housing market turned sour before the housing crisis.
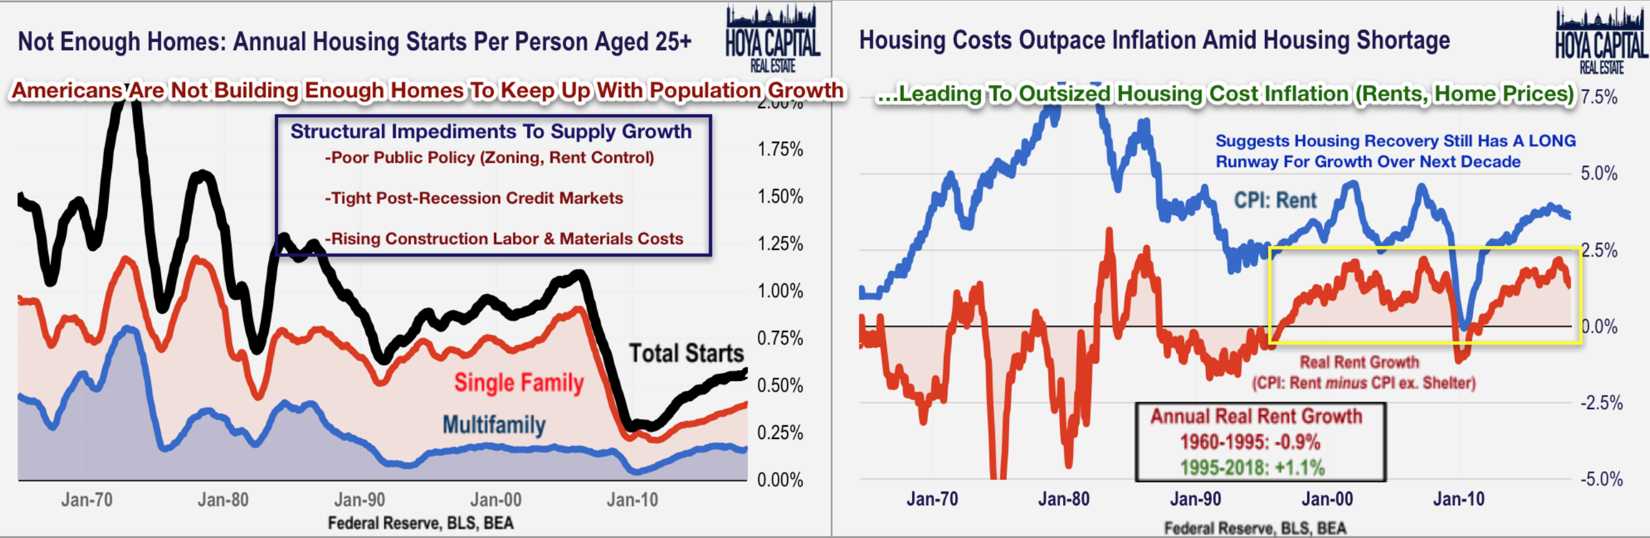
As we continue to discuss, the United States is not building enough new homes, and rental REITs are among the direct beneficiaries. Amid the lingering housing shortage, long-term rental fundamentals remain highly favorable. Since 1995, shelter inflation has outpaced the broader rate of inflation by more than 1% per year, fueled by a persistent supply shortage in the US housing markets. Over the last three decades, structural impediments to supply growth, aggravated by the dramatic dislocations during the housing crisis, have dramatically slowed the rate of housing starts per capita. The implications of this housing shortage, we believe, will be a continued persistence of “real” housing cost inflation (rent growth) and a long runway for growth in residential housing construction.
Solid Trends in Retail Continue
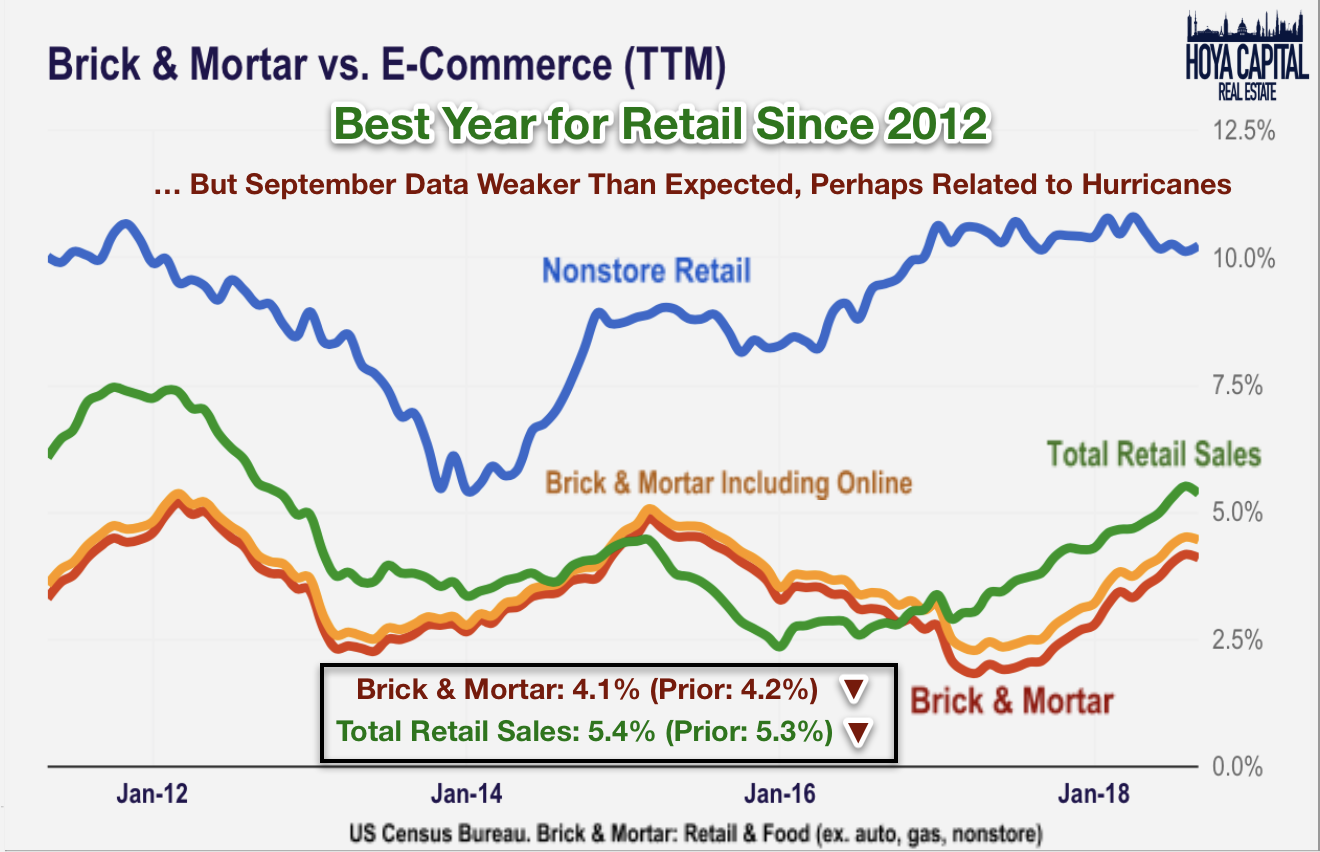
Retail sales, particularly in the traditional brick-and-mortar categories, continued their positive momentum into September, albeit at a slightly cooler rate than expected. On a trailing twelve-month basis, growth in total retail sales climbed 5.4% while brick-and-mortar sales have risen an impressive 4.1%. A sharp decline in restaurant sales, likely related to the disruptions from Hurricane Florence and Michael, dragged down the otherwise solid monthly data.
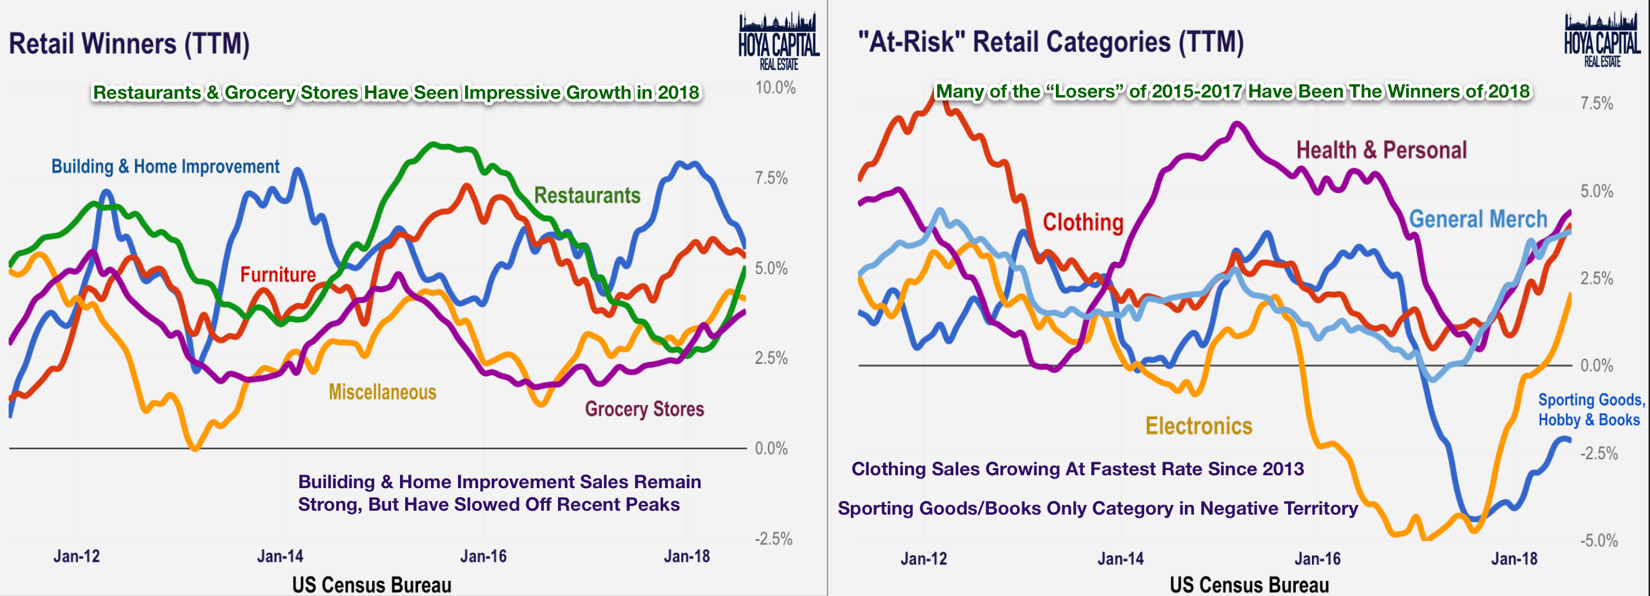
On a TTM basis, four of the ten brick-and-mortar categories ticked higher on the month, led by food, clothing, electronics, and health/beauty sales. Redbook Retail Sales data noted a robust 5.8% YoY rise in same-store retail sales, a trend that has been confirmed by recent retail earnings reports. Consistent with weak trends in the housing market, building materials and furniture sales have trended down in recent months following a period of robust strength.
JOLTS, Industrial Production Both Strong
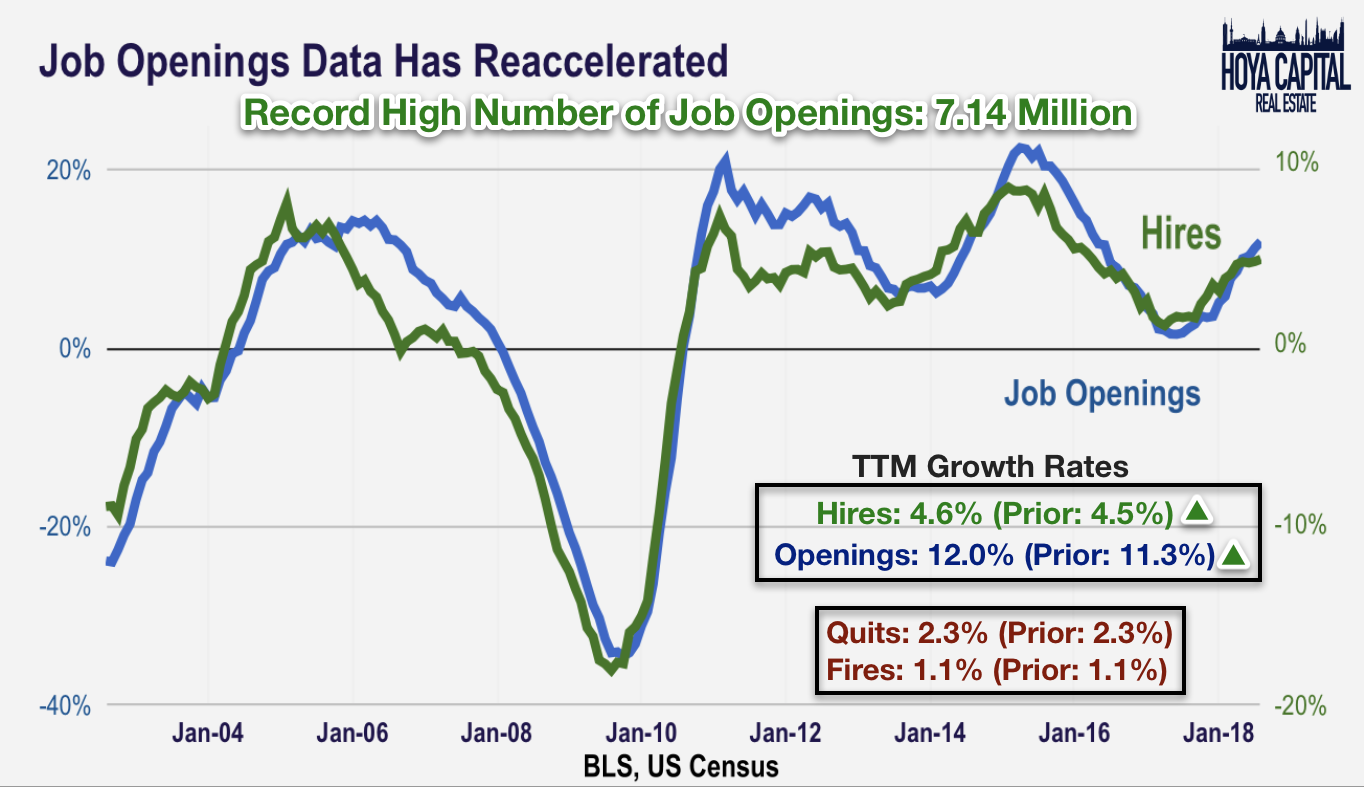
Evidence of broad-based strength in the labor markets continues to show across nearly all metrics, as deregulation and corporate tax reform appears to have added another leg to the labor market recovery. More than 2.5 million jobs have been added so far in 2018, representing a significant uptick in hiring from the rate of 2016 and 2017. This week, JOLTS showed that a record 7.14 million jobs are available and the rate of hiring rose to 4.5% on a TTM basis, the highest rate since 2015.
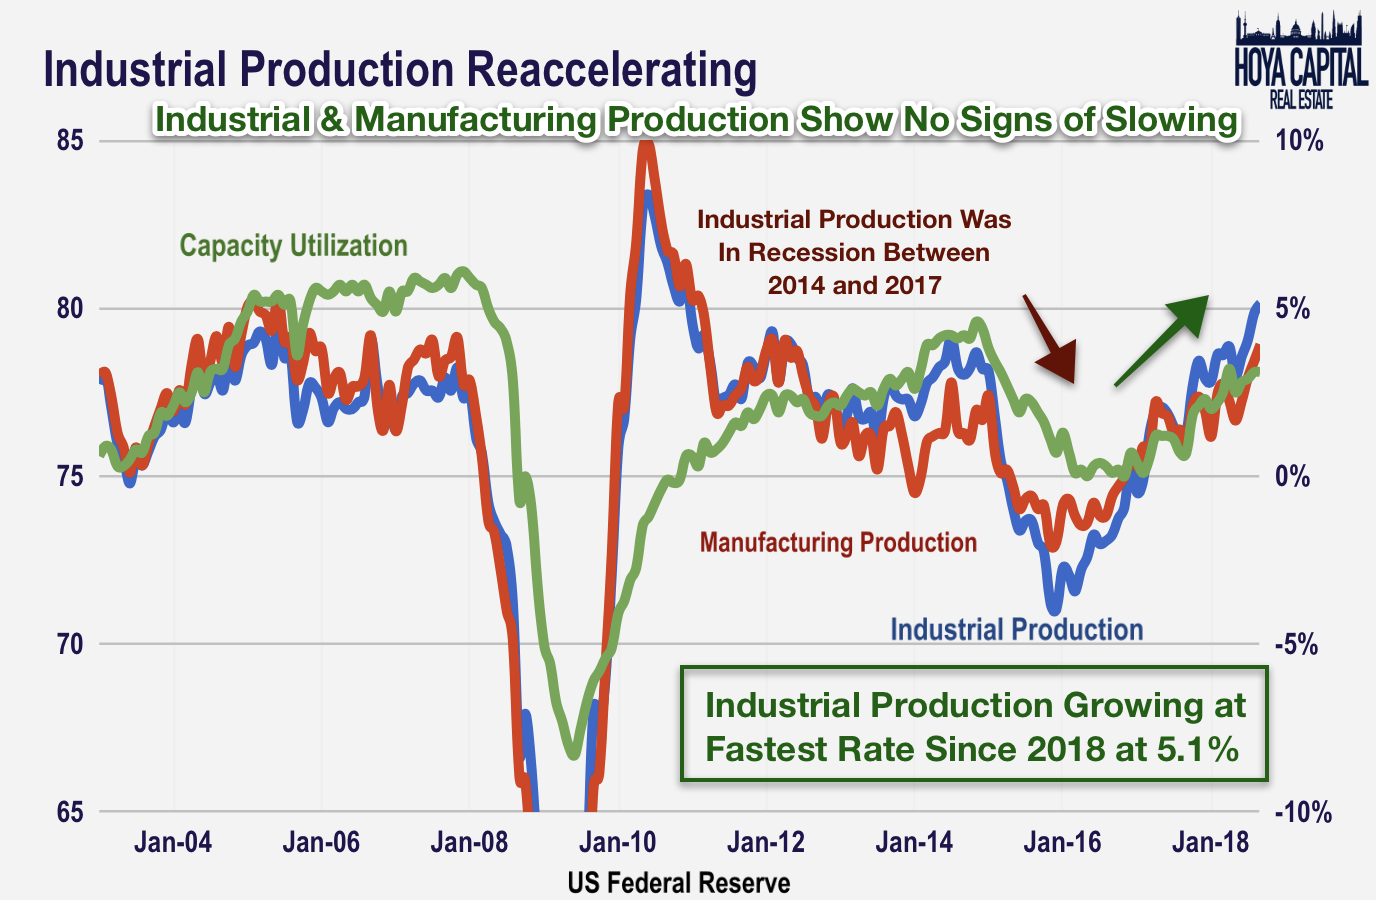
The story behind the post-election economic reacceleration has been a dramatic resurgence in the goods-producing economic sectors. Industrial production, which had dipped recessionary territory between 2014 and 2016, has surged since late 2016. At 5.1% YoY growth, industrial production is growing at the fastest rate since 2010. Capacity utilization, interestingly, remains well below levels seen during the mid-2000s economic expansion, suggesting continued slack and room for further production growth.
Earnings Season Update
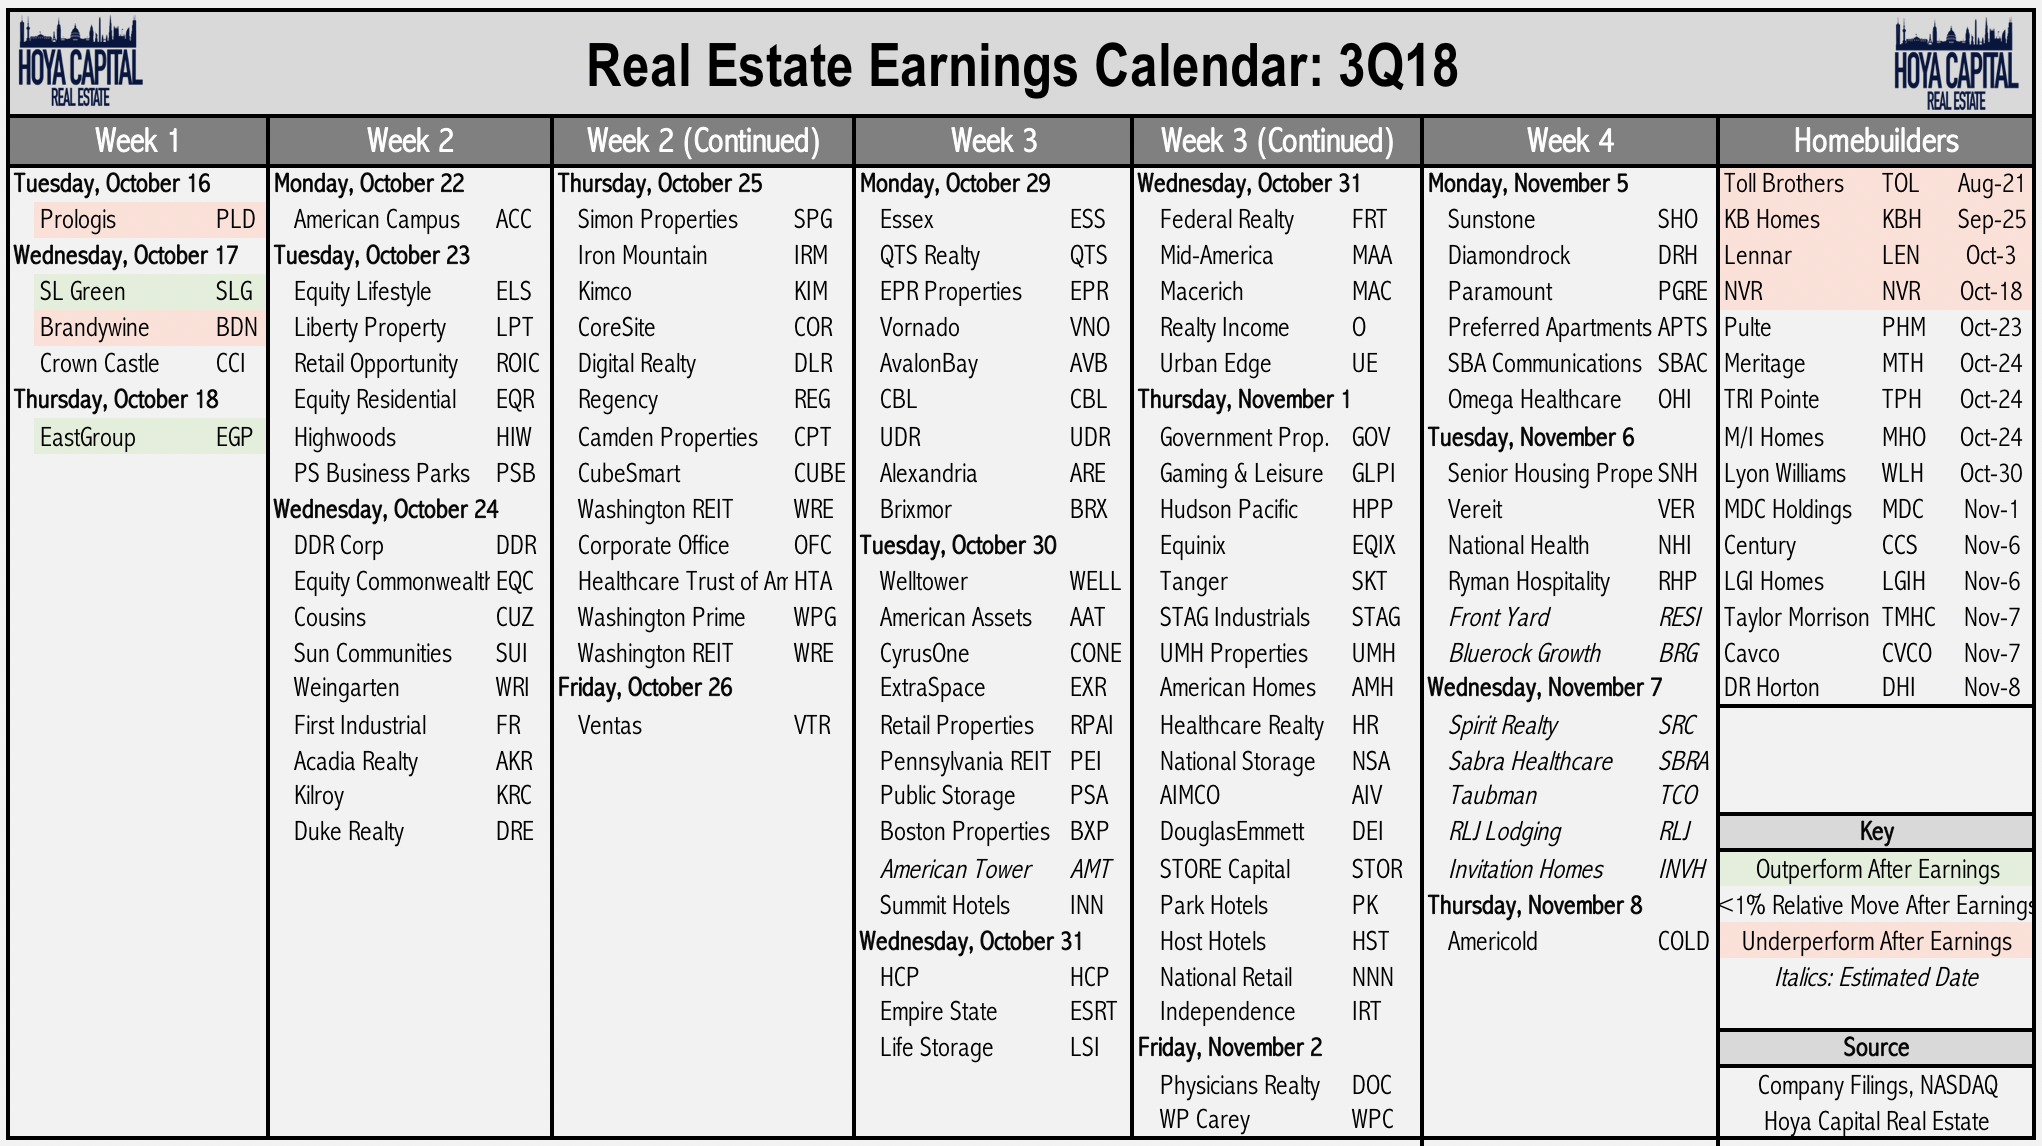
This week, we published our Real Estate 3Q Earnings Preview. Earnings season began this week in the real estate sector highlighted by REITs Prologis (PLD), SL Green (SLG), EastGroup (EGP). Housing 100 components reporting earnings this week included building supplier PPG (PPG), and regional financials including U.S. Bancorp (USB), M&T Bank (MTB), BB&T (BBT), KeyCorp (KEY). So far, REITs have gotten off to a solid start with solid results from PLD and EGP while soft results continued in the homebuilding space from NVR. Below is the full earnings calendar for the 100 largest REITs and 15 largest homebuilders.
2018 Performance
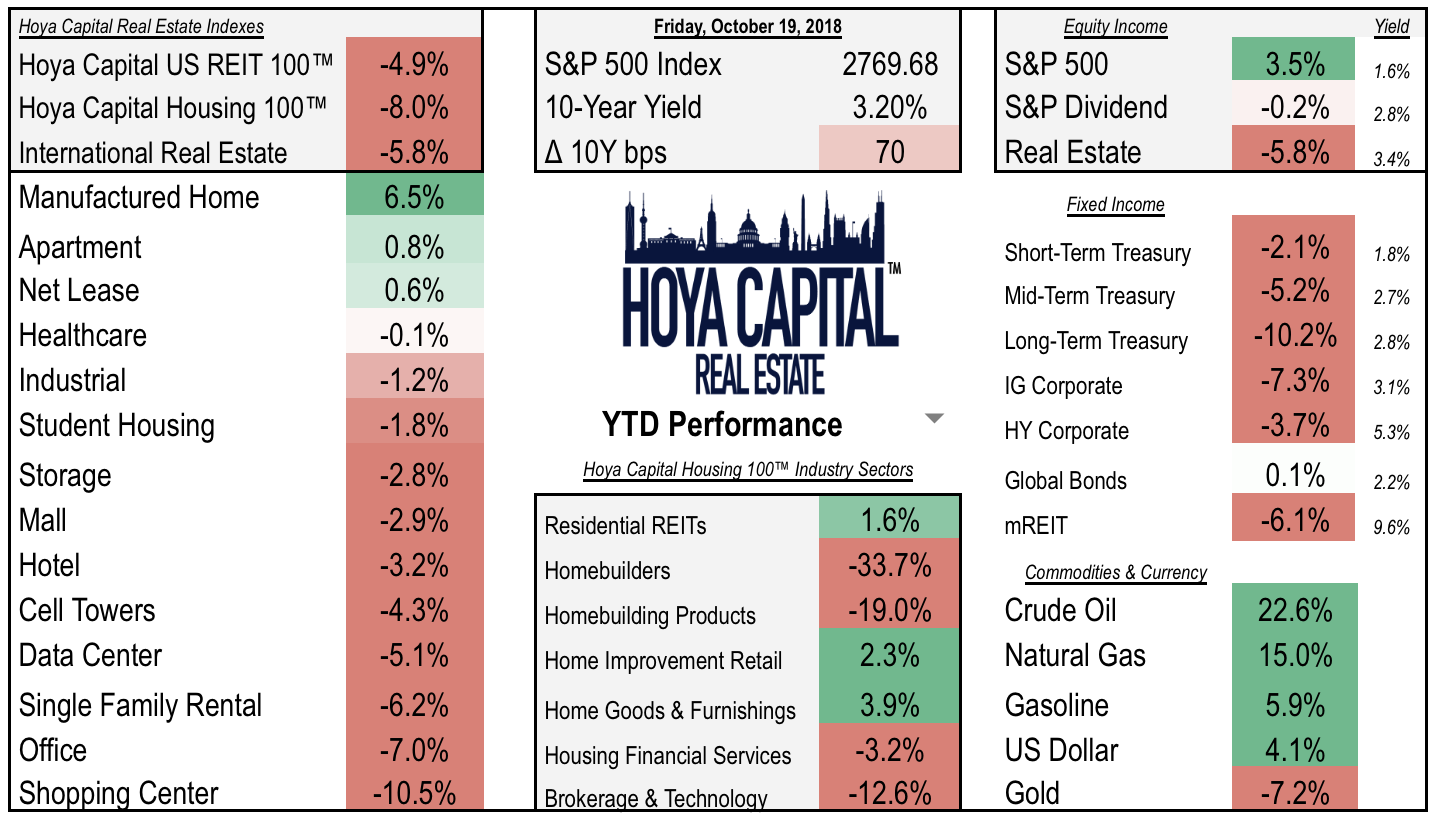
REITs are now lower by 5% YTD on a price basis, lagging the 3.5% gain in the broader S&P 500. The manufactured housing sector has been the top-performing REIT sector while shopping centers continue to lag. Homebuilders are off by more than 30% after rising more than 50% last year. The 10-year yield has climbed 70 basis points since the start of the year, aided by the 23% climb in the price of crude oil and 6% rise in gasoline prices.
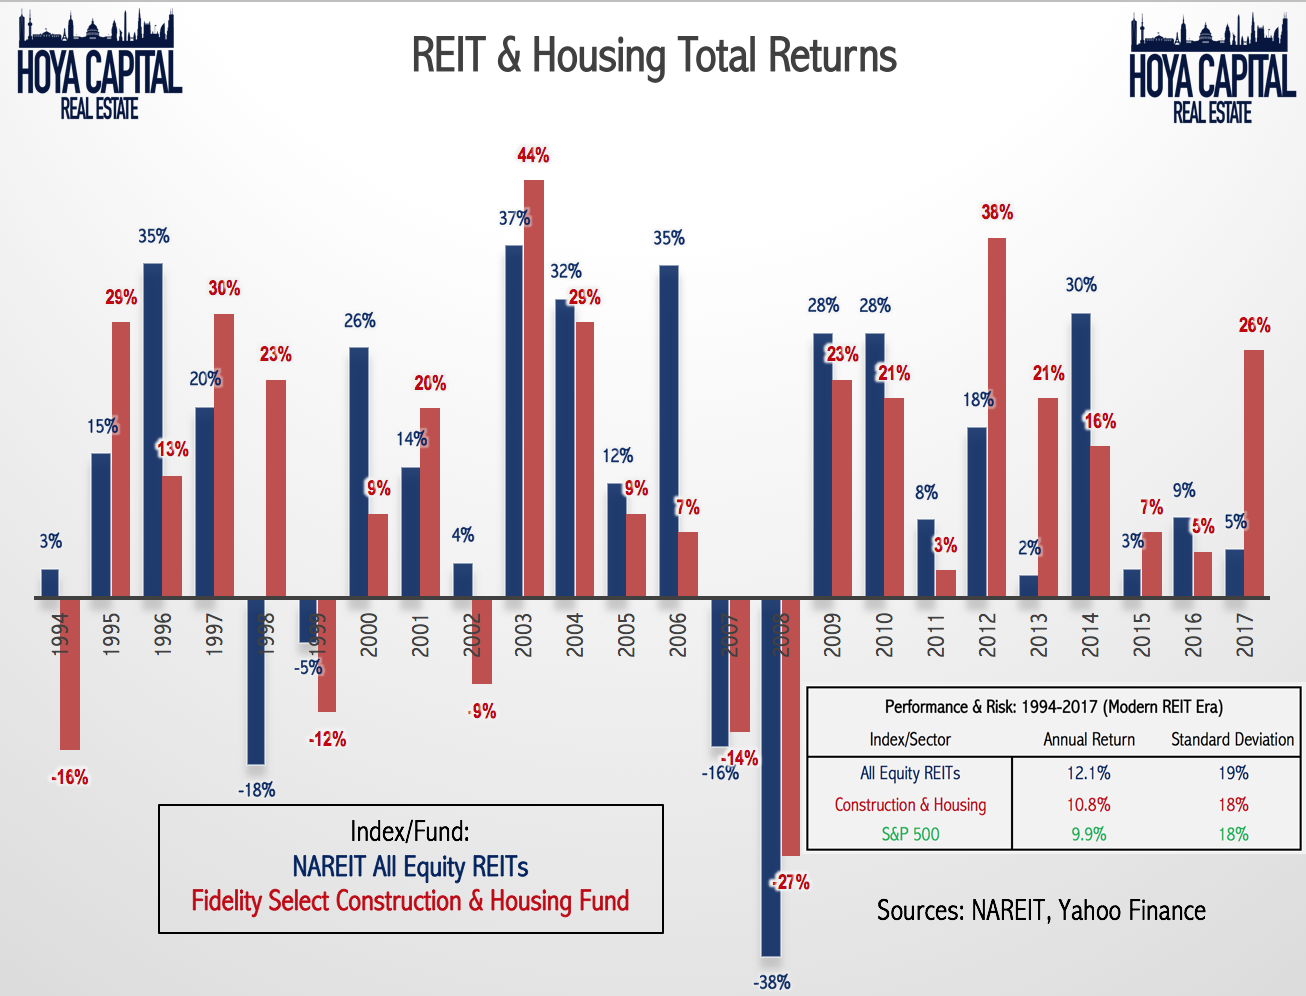
REITs and housing-related equities have outperformed the broader US stock market over the last 25 years. The NAREIT All-Equity REIT Index has delivered a 12.1% average annual return while the Fidelity Select Construction & Housing Portfolio (FSHOX) has delivered a 10.8% annual return since 1994. The S&P 500, meanwhile, delivered a 9.9% annualized rate of return during this period.
Bottom Line: REITs Climb, Homebuilders Dip
Bouncing back from the worst week for US equities since March, the S&P 500 squeezed out a modest weekly gain, led by the defensive and yield-oriented equity sectors. On a jam-packed week of housing data, homebuilders and building suppliers took another leg lower, extending their steep YTD losses. The Housing 100 has dipped 10% over the last month.
Housing starts, permits, and existing home sales data all missed estimates in September as the single family markets experience headwinds from higher mortgage rates and the effects of tax reform. While the housing market is showing signs of softness, US labor markets and industrial production continue to show unrelenting strength. Job Openings data broke new records in September at 7.1 million. Industrial production is growing at the fastest rate since 2010.
With earnings season beginning this week, be sure to check out all of our quarterly updates: Single-Family Rentals, Data Center, Apartments, Cell Towers, Manufactured Housing, Net Lease, Malls, Industrial, Shopping Center, Hotel, Office, Healthcare, Industrial, Storage, Homebuilders, and Student Housing.
Please add your comments if you have additional insight or opinions. We encourage readers to follow our Seeking Alpha page (click “Follow” at the top) to continue to stay up to date on our REIT rankings, weekly recaps, and analysis on the real estate and income sectors.
Disclosure: I am/we are long VNQ, SPY, XHB, PLD.
I wrote this article myself, and it expresses my own opinions. I am not receiving compensation for it (other than from Seeking Alpha). I have no business relationship with any company whose stock is mentioned in this article.
Additional disclosure: All of our research is for informational purposes only, always provided free of charge exclusively on Seeking Alpha. Recommendations and commentary are purely theoretical and not intended as investment advice. Information presented is believed to be factual and up-to-date, but we do not guarantee its accuracy and it should not be regarded as a complete analysis of the subjects discussed. For investment advice, consult your financial advisor.
Be the first to comment