The U.S. Energy Information Administration has recently released their natural gas monthly statistics for July, 2018. In this article, we will briefly review their consumption and exports figures, then look at our estimates for August and September and conclude with our forecast for October, November and December.
July Overview
Aggregate demand (national consumption + exports) for American natural gas surged by 10.8% y-o-y in July, 2018. Consumption jumped by 9.5% y-o-y due to very warm weather (there were 6.7% more cooling degree-days in July, 2018 vs July, 2017). External demand also remained strong, mostly due to robust LNG sales, which jumped by 83% y-o-y. However, pipeline outflows into Mexico also increased (by 9.0% y-o-y), while exports into Canada dropped by 3.7% y-o-y. Strong exports growth and an increase in national consumption ensured that the growth in total demand stayed positive. In fact, on an annualized basis, aggregate demand has not posted a single negative growth figure since January 2010 (see the chart below).
Source: EIA, Bluegold Research estimates and calculations
Total demand continues to grow faster than consumption, a trend that has been in place since May 2015. It points to the rising weight of exports within the overall demand structure. On the chart above, you can clearly see that growth rates in consumption and exports often diverge. Despite occasionally weak consumption, total demand is still growing in annual terms due to very strong exports rate. Previously, however, total demand growth was almost entirely driven by national consumption.
Pipeline and LNG exports combined totaled 303 bcf or 10.1 bcf per day in July. The volume of total exports is now equivalent to 13.0% of national natural gas consumption on a monthly basis. On a 12-month average basis, exports now equate to around 11.80% of national consumption and its share in the aggregate demand structure has more than doubled over the past three years.
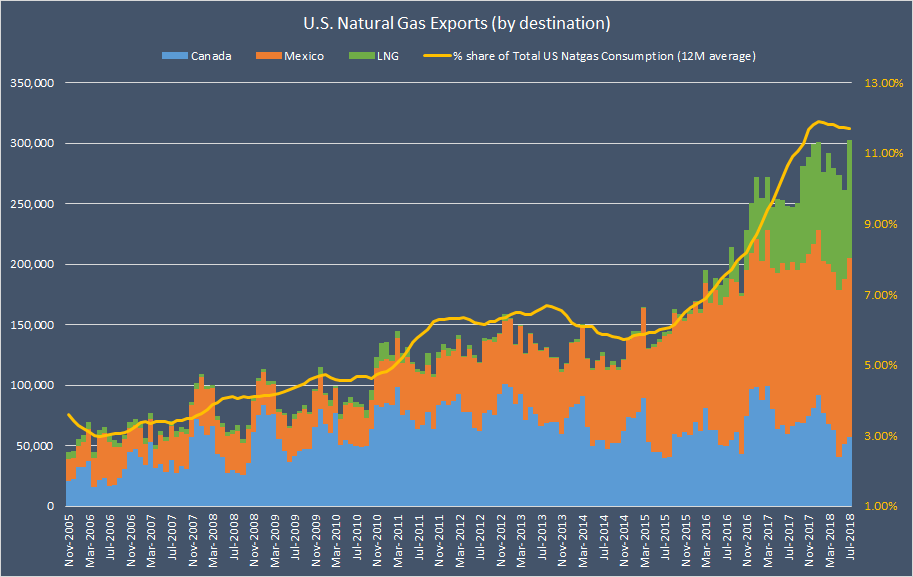
Source: EIA, Bluegold Research estimates and calculations
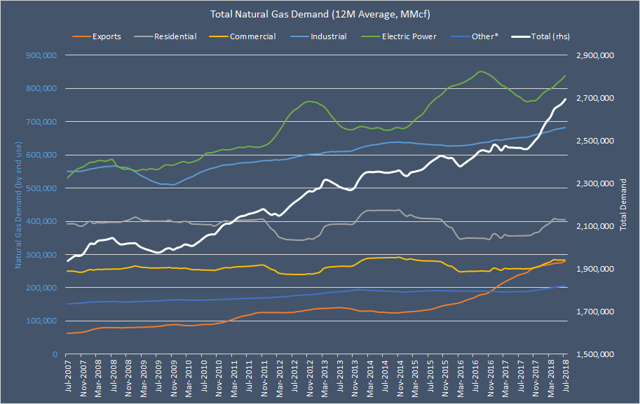
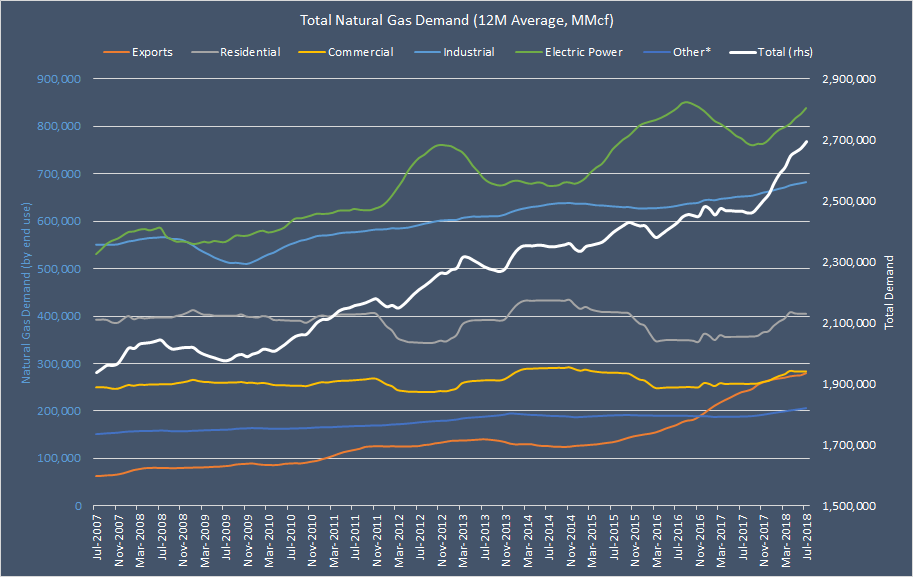
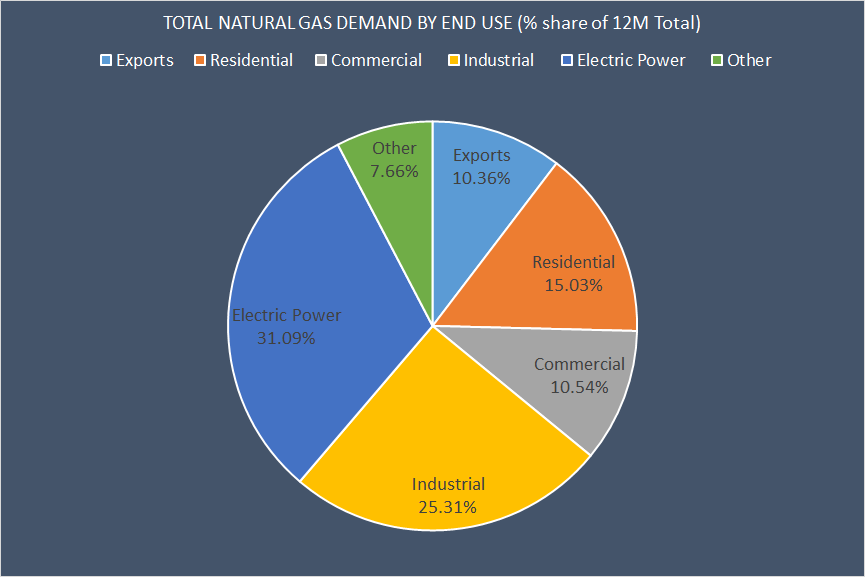
Exports remain the fastest growing source of demand for American natural gas. While total demand (12-month average) increased by 18.00% over the past five years (from July 2013 to July 2018), exports almost doubled over the same period. In fact, exports have already surpassed “Other” category in the overall demand mix and are now just as significant in weight as U.S. commercial users (see the chart below).
Source: EIA, Bluegold Research estimates and calculations
*Other category includes lease, plant and vehicle fuels, as well as pipeline and distribution use.
Other fast-growing sources of demand include Electric Power / power burn (+21.3% since July 2013) and industrial consumption (+11.8%). Notice that over the past five years, residential and commercial consumption has remained virtually unchanged.
Source: EIA, Bluegold Research estimates and calculations
Estimates and Forecast
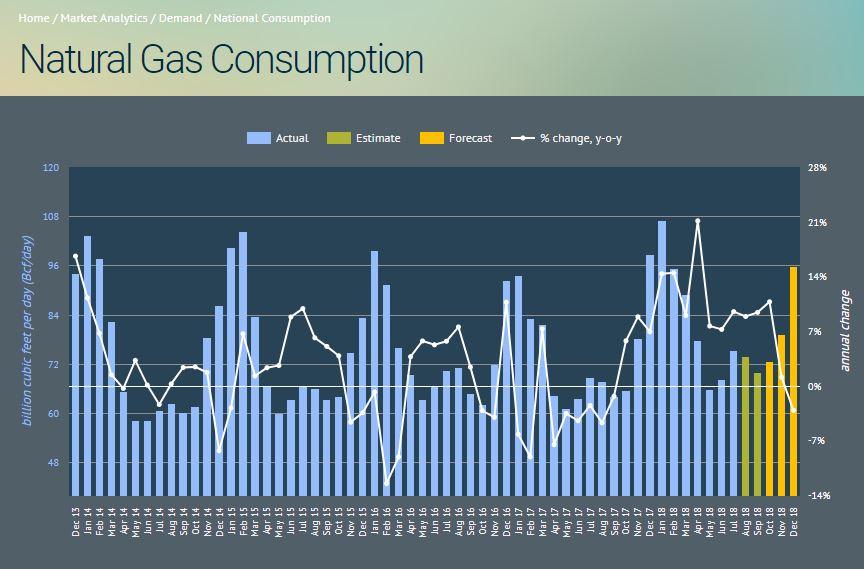
After rising by 9.5% y-o-y in July, we estimate that natural gas consumption then rose by 8.9% and 9.5% y-o-y in August and September, respectively. Weather-induced cooling demand grew by 17.5% and 10.8% y-o-y in August and September, respectively. However, coal-to-gas switching also provided a healthy boost to consumption as the spreads between natural gas and coal remained historically low.
Despite higher number of total degree-days (TDDs) in both August and September (vs. previous year), the ratio of consumption per degree-day also increased (by around 1% y-o-y). It means that a lot of so-called “structural consumption” took place. And therefore, it is particularly surprising that the market allowed natural gas price to fall below $2.900 per MMBtu in both August and September. This kind of price action has created a false image that the market is not concerned about the possibility of seeing low level of storage at the end-of-injection-season.
Under the latest weather forecasts, we anticipate to see an average 3.0% annual growth rate in consumption in October, November and December. However, the growth rate will vary significantly for each month (see the chart below). For example, at this moment in time, we expect consumption to increase by 11% y-o-y in October (due to higher nuclear outages and above normal amount of heating-degree-days). However, we also currently expect consumption to decline by 3.1% y-o-y in December (due to just normal HDDs and very unfavorable base effect).
Please note that there is a large degree of uncertainty to that forecast, as weather models remain volatile and can generate sporadic changes in the number of cooling- and heating-degree-days (CDDs and HDDs). It is also important to remember that changes in HDDs have 3x stronger effect on natural gas consumption than changes in CDDs, so monitoring weather forecasts on a daily basis is absolutely vital. We believe that HDDs are already driving short-term consumption.
We update our forecasts on a daily basis. If you wish to receive a regular update on key natural gas variables – weather, production, consumption, exports and imports – consider signing up for our exclusive content (see the link below).
Source: EIA, Bluegold Research estimates and calculations
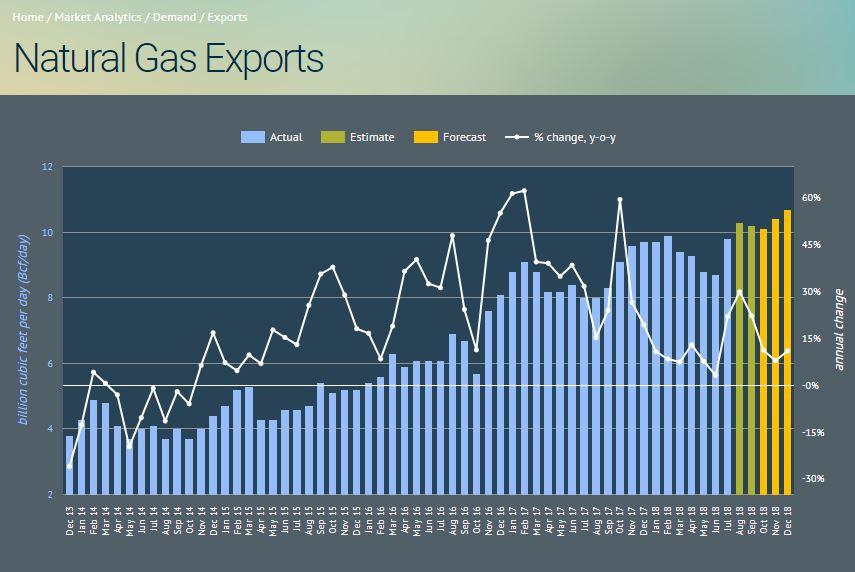
Exports should continue to expand, but annual growth rate will be slowing due to base effects. We estimate annual growth rate was probably just around 30.0% in August and 22.0% in September. Currently, we expect exports to total 10.1 bcf per day in October, 10.4 bcf per day in November and 10.7 bcf per day in December (see the chart below). Please note that our LNG exports forecast is based on vessels tracking system, not on the liquefaction flows. Therefore, it is very likely to be revised higher.
Source: EIA, Bluegold Research estimates and calculations
Total Balance
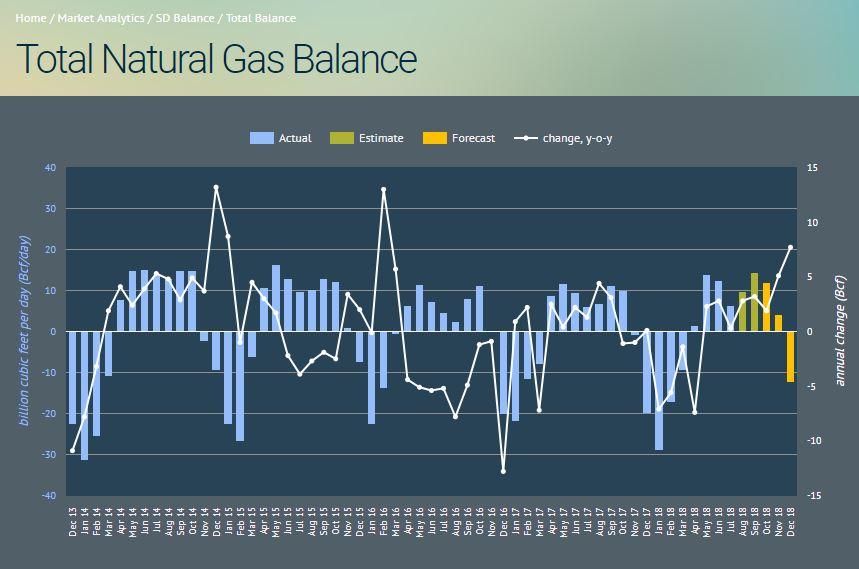
What about supply? After all, it is not the demand which is driving the price, but the interaction between demand and supply. No doubt, dry gas production is strong. We estimate that it is currently at least 19% above 5-year average. At this moment in time, we expect dry gas production to remain above 86 bcf/d for the rest of the year. As before, however, our forecast will be updated on a daily basis as more data gets processed. Overall, we believe that over the next three months, total supply will be growing faster (on an annualized basis) than total demand ensuring that total supply/demand balance will be looser relative to 2017. We estimate that annual surplus will amount to 1.9 bcf per day in October, 5.1 bcf per day in November and 7.7 bcf per day in December (see the chart below).
Source: EIA, Bluegold Research estimates and calculations
Thank you for reading our monthly report. We also write a daily update of our forecast for key natural gas variables: weather, production, consumption, exports, imports and storage. In addition, every Sunday, we publish three special reports: “Trends in the U.S. Electric Power sector”, “Trends in Global LNG Market”, “Global Oil Products Inventories”. Interested in getting this daily update? Sign up for Natural Gas Fundamentals, our Marketplace service, to get the most critical natural gas data.
Disclosure: I/we have no positions in any stocks mentioned, and no plans to initiate any positions within the next 72 hours.
I wrote this article myself, and it expresses my own opinions. I am not receiving compensation for it (other than from Seeking Alpha). I have no business relationship with any company whose stock is mentioned in this article.
Be the first to comment