Suddenly, everyone is talking about the stock-bond return correlation again.
This week’s rapid run up in long-end Treasury yields is the proverbial talk of the town and judging by Thursday and Friday, equities’ patience with rising yields ran out at roughly 3.20% on the 10-year.
I’ve spent a lot of time discussing a prospective “flip” in the correlation between stocks (SPY) and bonds (TLT) this week in an effort to perhaps provide readers with more information on the issue than they might otherwise be privy to.
On Saturday, I wanted to try and pen something that functions less like a long-winded romp through the intricacies of the subject and more like a concise pocket guide to what matters and why.
As a reminder, I warned folks that this discussion was about to take center stage weeks ago in a post for this platform called “Flipping Out“. The date on that post is September 8 or, more to the point, one day after the August jobs report showed wage growth accelerating at the fastest pace since 2009.
That brings me neatly to the first of two points I want to address here and again, I’m going to break the Heisenberg mold and try to make this as concise and straightforward as possible.
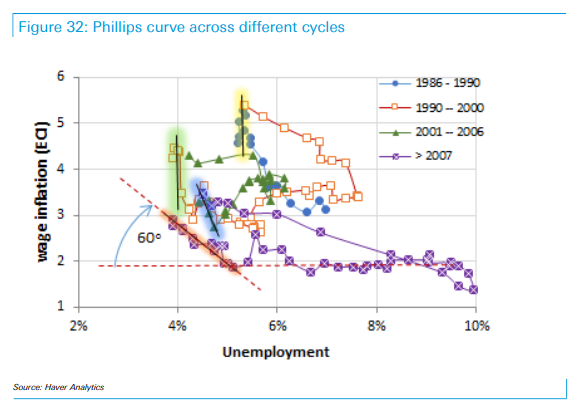
Wage growth is the so-called “missing ingredient” for the economy and, by extension, for the Fed. This is a long and winding debate, but the bottom line is that with unemployment trending below the rate the Fed considers sustainable over the longer run, the models would suggest that wage growth should accelerate, probably sharply, pushing the slope of the Phillips curve to almost 90°. Currently, it’s at around 60° which, as Deutsche Bank’s Aleksandar Kocic writes in his latest note, gives Jerome Powell a 30° “cushion” between now and when the Fed is officially behind the curve (more here).
Here is the visual which traces the evolution of the Phillips curve throughout historical cycles (do note that while I’ve used a similar chart before, this is the updated version):
(Deutsche Bank)
In his Friday piece, Kocic suggests that the above-mentioned 30° “cushion” is what stands between us and a sustainable flip of the equity-rates correlation, which Deutsche Bank’s analysis occurs “between approximately 250bp and 300bp over r*.” That equates to 10-year yields at between 3.20% and 3.70%.
This is why I started talking about the stock-bond correlation again after the August jobs report (i.e., in the post linked above). What you’re watching for is that “straight-line” rise in wage growth that would typically begin to show up in late-stage expansions in response to incrementally positive economic data. If you see that acceleration, the sign on the equity-rates correlation flips, and assuming bonds continue to sell off, stocks would suffer. Here is Kocic describing the “fatal attraction” of correlations:
The additional measures of liquidity [post 2008] injection created conditions where both stocks and bonds performed well. And nobody complained because there was nothing to complain about. We were seduced by correlations. This was good while it lasted, but the obvious problems would arise when we face the prospects of unwind of stimulus and reversal of the QE mode. The inertia of that unwind would push the markets naturally from rally in stocks and bonds to sell off in both assets. This is the “fatal attraction” of correlations, a scenario to which there is no adequate monetary policy response.
That’s the first of two points I wanted to make here.
The second point relates to the rapidity of rate rise. In several of my posts this week (both here and on my site), I’ve mentioned that if you don’t want to think too hard about this issue, but you’re still interested in knowing when you should perhaps worry about a sign change in the equity-rates correlation, you can skip the pontificating about the Phillips curve and generally eschew in-depth historical analysis of the relationship between stocks and bonds for a simple rule of thumb.
A rapid rise in yields (quick selloff in bonds) has the potential to spook markets irrespective of the cause/interpretation. As I’ve been at pains to explain all week, the interpretation matters when it comes to rising yields. If equities perceive that yields are rising in response to (and in step with) upbeat economic data, then risk assets can (and likely will) continue to perform as bonds sell off. However, there’s a speed limit. That is, if yields rise too far, too fast, the interpretation (i.e., the “why?”) isn’t likely to matter, at least in the very near-term.
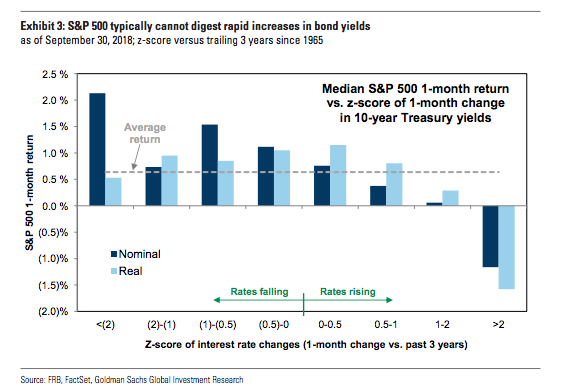
The rule of thumb I mentioned above comes from Goldman, who, back in late January/early February, noted that a 2-standard deviation rise in 10-year yields in a month generally weighs on stocks. Here’s Goldman reiterating the point in a note dated Thursday:
However, S&P 500 returns have typically been negative in months where bond yields have risen by more than 2 standard deviations. When bond yields have surged by 1-2 standard deviations in a month (~20-40 bp today), S&P 500 returns have typically been flat. When bond yields have risen by more than 2 standard deviations in a month (~40+ bp), S&P 500 returns have typically been negative (see Exhibit 3). Even including [Thursday’s] price action, the S&P 500 is still up 0.5% during the past month despite the nearly 2 standard deviation move in bond yields.
For reference, here’s some context between the move from September 5 through Friday versus the January bond rout:
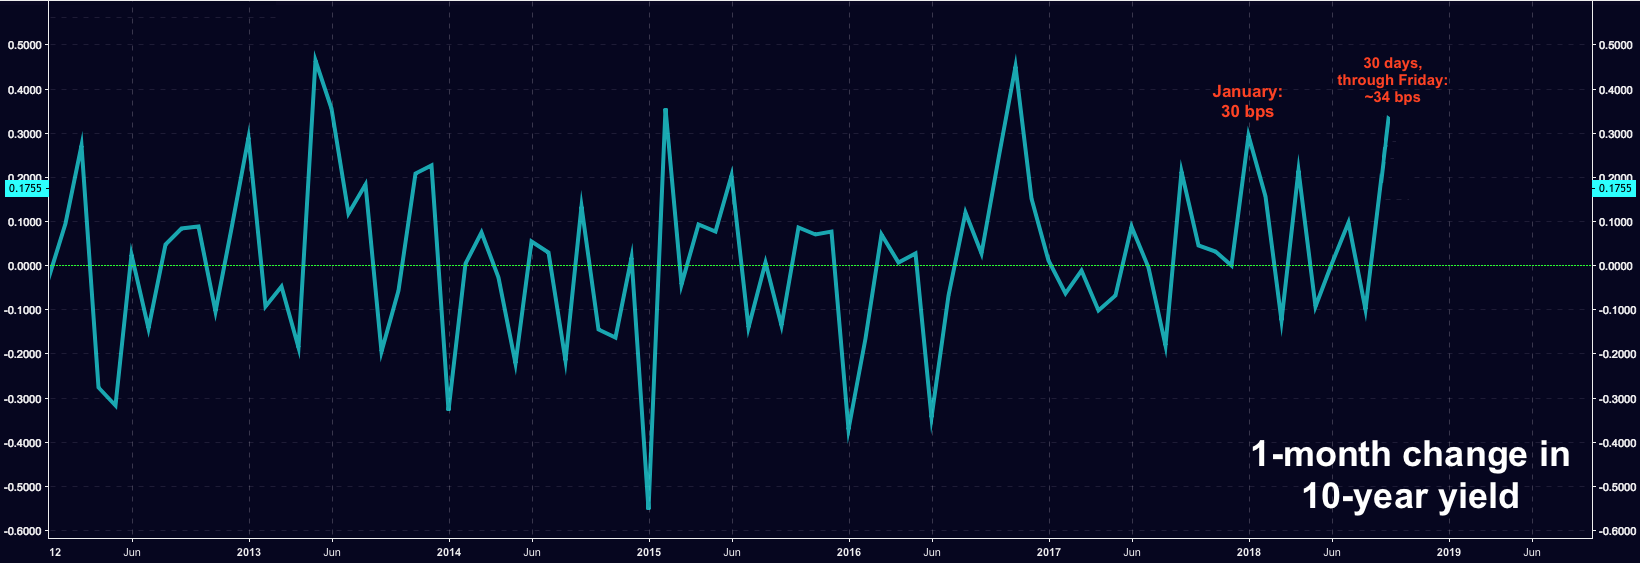 (Heisenberg)
Basically, the recent move is a 2-standard deviation event, versus January’s ~1.7 standard deviations, and given what you see in the Goldman chart above, it should come as no surprise that equities sold off on Thursday and Friday as 10-year yields continued to push higher.
So, the two simple takeaways here are as follows:
- In the post-crisis world, the “attraction” of the diversification benefit inherent in a negative stock-bond return correlation (positive equity-rates correlation) was magnified by an “everybody wins” scenario, where both stocks and bonds generally rallied. Now, that attraction has the potential to turn “fatal”.
- The speed of the bond selloff matters even if the interpretation of rate rise is benign. That is, even if rising yields are a sign of economic strength, a 2+ standard deviation move in 10-year yields in the space of a month generally weighs on stocks irrespective of the interpretation.
Hopefully, the above will serve as a helpful pocket guide for those seeking to make sense of the conversation that now dominates the market narrative amid the burgeoning bond rout.
Disclosure: I/we have no positions in any stocks mentioned, and no plans to initiate any positions within the next 72 hours.
I wrote this article myself, and it expresses my own opinions. I am not receiving compensation for it (other than from Seeking Alpha). I have no business relationship with any company whose stock is mentioned in this article.
Be the first to comment