“Humans think in stories rather than in facts, numbers, or equations, and the simpler the story, the better.” – Yuval Harari in 21 Lessons for the 21st Century
And the stories don’t even have to be true. In fact, there is good evidence that Homo Sapiens evolved from being a rather unremarkable ape to dominating the planet because they were able to ‘make stuff up’. The ability to create, and just as importantly, share virtual realities (stories) allowed early members of our species to cooperate in increasingly large numbers; if members from different tribes can share and believe in the same stories, then conflict is reduced and cooperation is increased. Cooperation accomplishes much more than conflict does, and common stories have optimized the former and minimized the latter. It is why religion is so ancient and enduring.
The idea of a corporation is itself a virtual entity that allows humans to cooperate in large numbers – it is a useful made-up story around which large numbers of people are organized. For instance, what is Google? Is it the buildings? Is it the people? Is it the information they possess? If all the buildings were sold, would Google cease to exist? How about if it got rid of all its employees, or declared bankruptcy? Even though any of these changes would likely result in a less successful corporation, the virtual entity called Google could still exist. From the beginning, it was just a made-up story, and as long as somebody believes the story, Google would continue to exist.
The entire stock market is a virtual entity. It exists only because the participants have enough confidence in the story to operate and take risks within its parameters. The stock market, however, has stories-within-stories which makes it incredibly complex and hard to understand. It can be especially confusing when some of the sub-stories contradict each other. In this piece, we look at two common stock market stories and compare them to the facts.
Story #1: Rising Rates Ruin Bull Markets
This story is widely talked about and uniformly believed; rising rates kill bull markets. Let’s look at the facts.
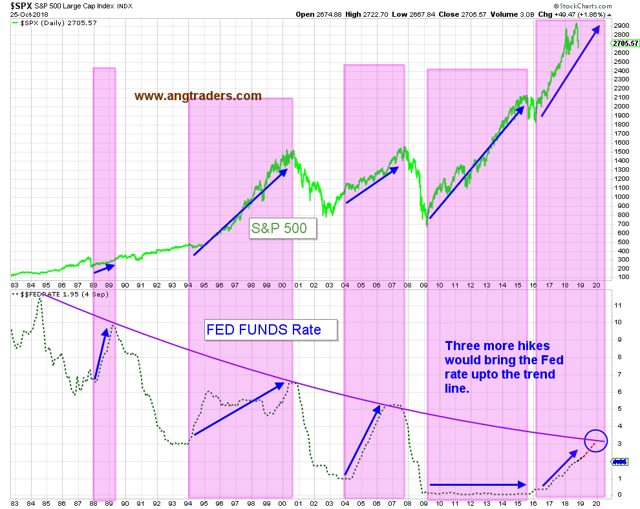
Chart 1 shows that each bull market, going back to 1988, occurred while the Fed was raising rates. It makes more sense to say that rising rates create bull markets than it does to say they destroy them.
CHART 1
Rates do affect the economy and, eventually, the stock market. But it is not rising rates that is the culprit, it is when rates get “too high” that problems materialize and the party ends. And what the market considers “too high” has been decreasing for the last 35 years.
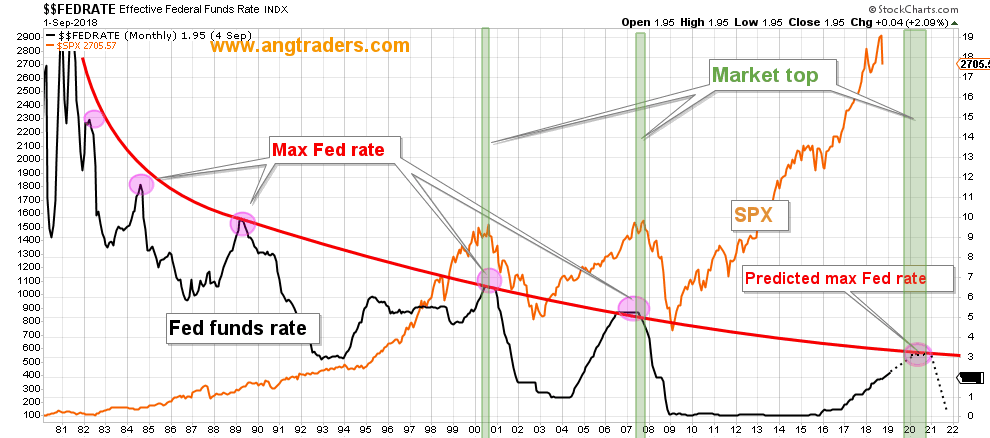
Chart 2 shows how the non-linearly decreasing maximum Fed rate trend-line corresponds with major market tops. At the current pace of rate hikes, the maximum Fed funds rate is in the area of 3% and is expected to be reached in Q4 of 2019, or Q1 of 2020. That means we have a full year before rates might start negatively impacting the economy and the stock market.
CHART 2
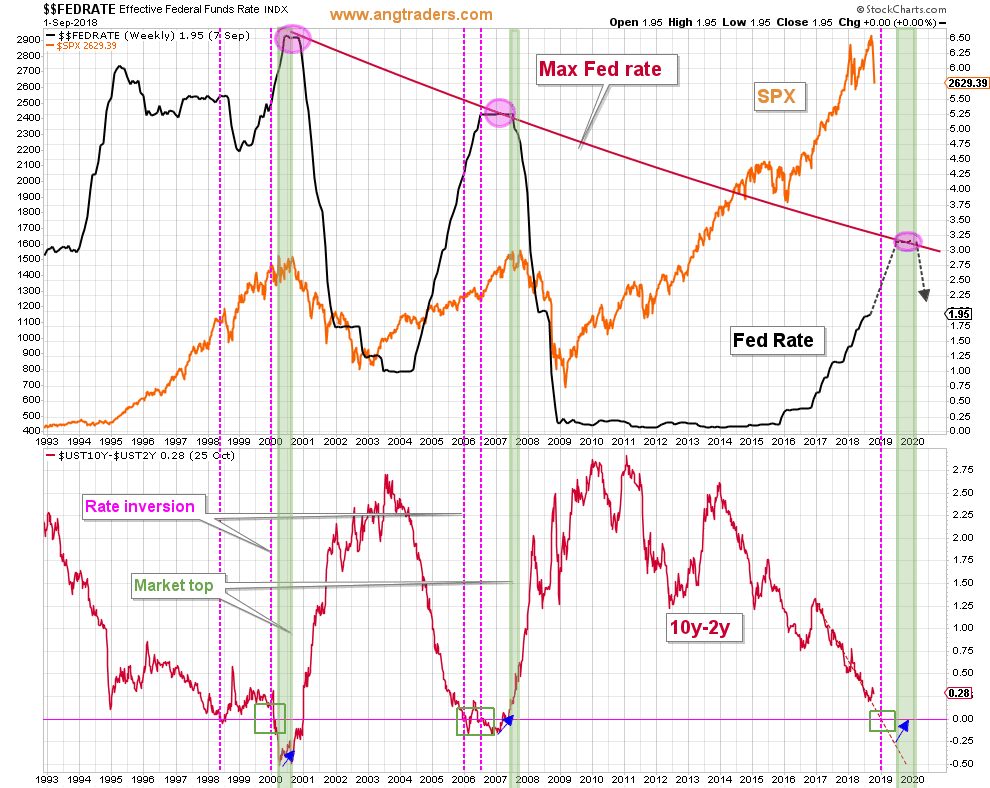
Advanced warning of interest rate-induced stress on the economy is provided by the 10-year minus 2-year Treasury yield differential. When the yield inverts (short rates move past long rates), it is a sign that the economy is being adversely affected by short-term money rates and that, as a consequence, the future is looking less rosy – hence, future rate cuts will be required in order to help a flagging economy. This warning comes between 6 and 12 months ahead of recessions and stock market tops.
Chart 3 shows a close-up of the last two bull markets along with the 10y-2y yield differential. The green-colored rectangles outline the yield inversions which precede the market tops by several months. At present, if the differential maintains its downward slope, we can expect an inversion of the yield curve in the first half of 2019 and a market top some time in 2020.
As confirmation of a top, notice that the differential rises just before, or at the start of market corrections (blue arrows on chart 3).
CHART 3
The story that rising rates destroy bull markets is simply not true and we are not likely to see a recession in the next 6 to 9 months. The 10% rout in stocks we are experiencing is a normal correction within an on-going bull market.
Story #2: The Stock Market is Overvalued
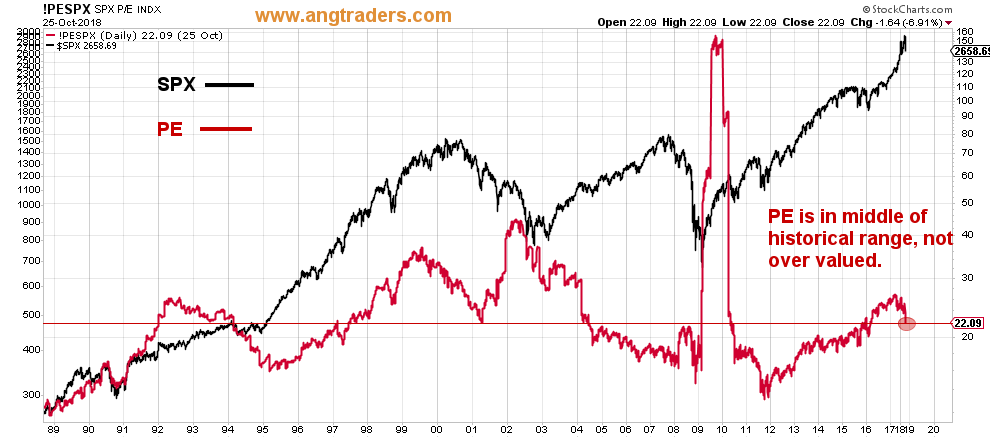
This story has been promulgated almost from the start of this bull market. The main indicator that is used to support the contention that stocks are overvalued is the price-to-earnings ratio or PE. Chart 4 shows the PE of the S&P 500 over the last two bull markets. At 22, the PE is in the middle of the historical range and not at an extreme.
CHART 4
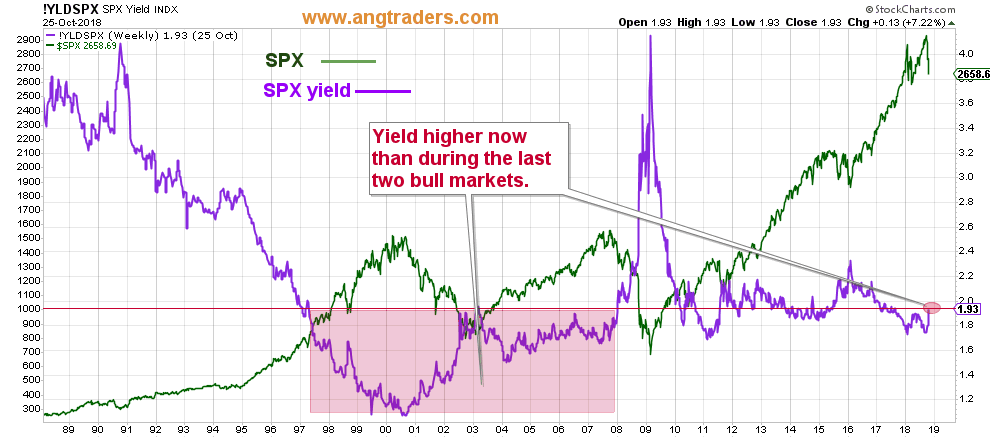
Another way of thinking about valuations in the stock market is to consider dividend yields; the lower the dividend yield is, the higher the valuation of the market. Chart 5 shows that the yield is higher now, at 1.93%, than at any time during the last two bull markets. By this measure, the market is not overvalued.
CHART 5
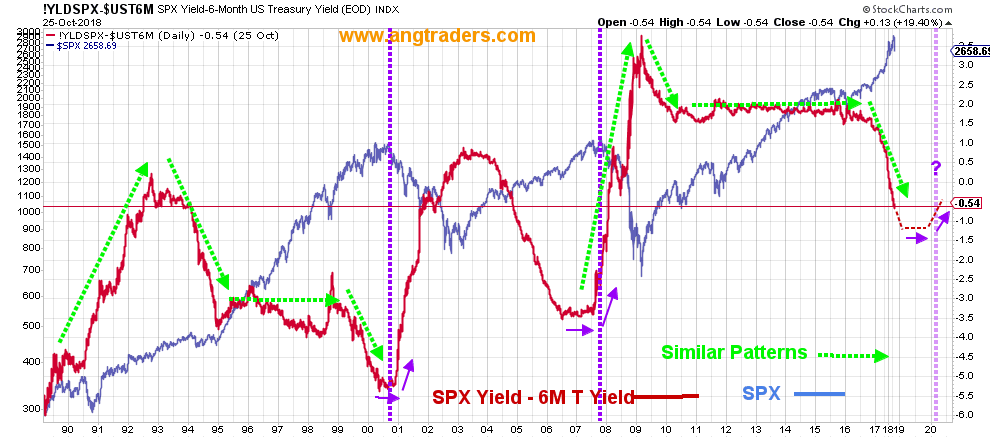
But what about the fact that neither PE nor dividend yield take interest rates into account. Looking at either of these measures in isolation, without comparing them to interest rate levels, is misleading; a dividend yield of 2% might be considered a good yield if interest rates are 1.9%, but not if rates are 3.9%. Our preferred measure of stock market value is the net yield, which is calculated by subtracting the 6-month Treasury yield from the dividend yield.
Chart 6 shows that, although the net yield went negative earlier this year, it is still at a historically high level when compared to the previous two bull markets. It is difficult to justify labeling the stock market as overvalued when the net yield is this high.
The chart also shows how the net yield tends to flatten (stop decreasing) ahead of major market tops (purple arrows). Until the net yield starts flattening, we are not worried about a bear market.
CHART 6
Both these stories have been accepted by the majority of participants as obvious and true, but the facts simply do not support either story.
We are experiencing a painful correction, but a normal correction is all it is. The secular bull market may be in its later stages, but it is not dead yet. The probability of a bear market in the next 6 to 9 months is lower than the probability of new highs.
We invite you to take advantage of the 14-day free trial to stay on the right side of the market and Away From the Herd.
Disclosure: I am/we are long SPXL.
I wrote this article myself, and it expresses my own opinions. I am not receiving compensation for it (other than from Seeking Alpha). I have no business relationship with any company whose stock is mentioned in this article.
Be the first to comment