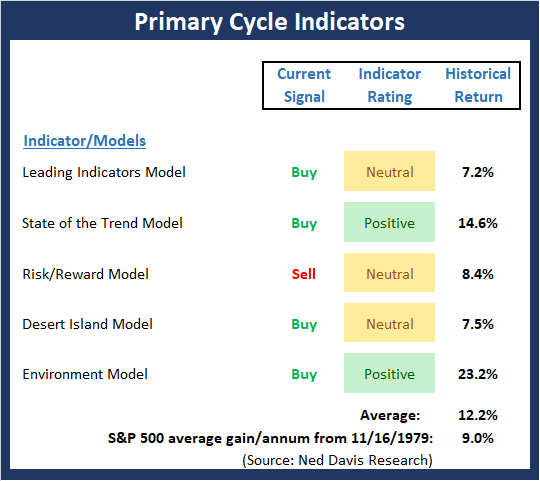
Before we dive in to any sort of subjective analysis about the current state of the markets or what may or may not come next, I think it is important to note that our Indicator Boards did a pretty darn good job of waving yellow flags well before the current correction began.
While I learned a long time ago that is a VERY bad idea to brag in this business, I would like to point out that the boards had been warning us for weeks that all was not right with the indicator world and/or that risk factors were elevated. For example, take a peek at the August 20 report titled, All Is Not Right With The World. As such, anyone paying attention to our weekly review of the state of the indicators should not have been surprised by some corrective action.
On a personal note, having some sort of a “heads up” that the indicators were not in their happy places in advance of the negative action gave us time to prepare and make some adjustments. For example, in portfolios that focus on market leadership, we have positions allocated to both the leading factors and the leading major market indices. For much of the year, selecting these positions had been easy-peasy. The leading factor had clearly been momentum and the leading major index had been the NASDAQ 100.
However, as the indicators faltered, and technical divergences developed, there was a distinct shift in our leadership work. So, at the beginning of the month, factor leadership shifted from momentum to minimum volatility and the NDX was replaced by the Dow. Whether or not this type of leadership holds beyond the next week or so is anybody’s guess. But I wanted to provide an example of how one could use the “message” from Indicator Boards that are updated here each week.
Getting back to the current market action, the timing and severity of the current correction probably did surprise a few folks, including yours truly.
Frankly, I had been looking for an extended period of “sloppy action” into the traditional “year-end rally” period. My thinking was that the market had to deal with growing uncertainty relating to rates, inflation, and the mid-terms, as well as the seasonal pattern and technical divergences. But, to be clear, I most certainly did not expect to see the Dow dive nearly 1400 points in a matter of hours (14 trading hours, to be exact) last week.
As the “fast money” folks love to remind us on their TV appearances, “risk happens fast” in this age of high-speed trading. And as I’ve opined a time or twenty, it is the propensity for trend-following algos to simply chase their tails until the closing bell rings (or a reversal occurs) that tends to exaggerate the type of move we saw last week.
Understanding the Algos
Another important thing to understand about how/why these market declines tend to occur in a fast and furious fashion is all the money tied to what is referred to as “systematic trading.” In English, this is forced selling created by quant-trading strategies favored by CTAs and other “volatility targeting” strategies. (Risk-parity would be the poster child here).
The key point to understand is that when the stock market makes a big move, these quant-based strategies automatically make adjustments on the fly. In simple terms, when stocks plunge, computers tell volatility-targeted portfolios to reduce their exposure to stocks and increase their exposure to lower volatility areas such as bonds.
So, as a stock market decline unfolds, these “systematic” strategies continue to rebalance their targeted volatility exposure in lock step. They simply rinse and repeat until the volatility target of the portfolio is achieved.
From my seat, this is important stuff to understand and helps explain what I like to call “algos gone wild” – or exaggerated moves in the market.
The Good News
The good news is that analysts are able to quantify the amount of “systematic” strategies out there, and, in turn, how much more selling these funds will need to do from here. Cutting to the chase, knowing how much stock still needs to be sold by computers can help us identify what is “real” and what is “artificial.”
So, here’s what I’ve found on the subject…
Nomura’s Charlie McElligott said that Thursday that based on the firm’s estimates, CTAs de-risked in equities to the tune of some $88 billion on Wednesday. McElligott also suggested that a break below 2719 would trigger further systematic de-risking to the tune of $57 billion in S&P futures. (Note that the S&P cash traded to a low of 2710.51 on Friday before quickly rebounding above the line in the sand.)
Next, according to JPMorgan’s Marko Kolanovic, who heads the firm’s global macro quantitative and derivatives research area, approximately 70% of the systematic selling that needs to be done has already occurred. In a research note dated Friday, Kolanovic wrote, “We think that the majority of systematic selling is behind us (~70%).”
Kolanovic went on to say, “The remaining part of systematic selling is from volatility targeting (insurance, parity funds, etc.) which will go on for several more days.”
The note added that JPM believes the recent selling pressure from systematic systems will likely wane going forward. Kolanovic explained that volatility targeters tend to sell over a longer period of time than other systematic strategies (between 3 and 10 days). As such, “these flows should be easier to digest by the market,” Kolanovic says.
According to Barclays Capital, volatility-controlled strategies/funds still needed to cut $130 billion in equities and another $40 billion in ETFs as Friday’s session began. So… if you were wondering why Friday’s bounce was less than robust and appeared to be met with some intense selling throughout the day, the work of these systematic sellers would appear to be the answer.
Looking Ahead
So, the question on everybody’s mind is, where do we go from here? As expected, the perma-bears tell us that all is lost, and that last week’s action was just the beginning of what surely will amount to the next 2008-type decline.
On the other side of the field, our heroes in horns suggest that the economy is strong, rates will remain historically constructive even after the Fed’s “terminal rate” is achieved, there are no signs of a recession or runaway inflation, and that earnings are expected to grow 12% next year. As such, conditions do not appear to be ripe for a bear market.
From my seat, reality likely lies somewhere in between, and it will take time for the macro picture to become clear again. To be sure, there are issues for investors to sort through. And what folks are thinking will likely become clearer as the “systematic selling” runs its course.
On that note, Kolanovic also suggests that it will soon be time to “buy the dip” – assuming, of course, that volatility doesn’t pick up again and ignite another round of risk-off selling, that is. Also, Nomura’s McElligott wrote a rather bullish piece on Friday entitled, “Making the case for equities long into year-end.” McElligott cited “cleaner positioning” after this week’s wash out, buybacks, and seasonality. And Goldman wrote Friday, “Despite the recent sell-ff, equity fundamentals are strong and we remain constructive on the past of the S&P 500,” with a year-end target of 2850.
I, for one, will be leaning heavily on my key market indicators to help me figure out whether this move will wind up in the garden-variety correction camp, or something far furrier.
Moving On… Now let’s turn to the weekly review of my favorite indicators and market models…
The State of the Big-Picture Market Models
I like to start each week with a review of the state of my favorite big-picture market models, which are designed to help me determine which team is in control of the primary cycle.
View My Favorite Market Models Online
The Bottom Line:
- There can be no denying that the Primary Cycle board has been waving a yellow flag regarding the overall state of the market for some time now. This week, the indicator rating of my Environment model actually upticked to positive, but by the skinniest of margins. It is also worth noting that the State of the Trend model is now close to issuing a bear market sell signal.
This week’s mean percentage score of my 5 favorite models improved a bit to 58.3% while the median pulled back to 58.3%.
The State of the Trend
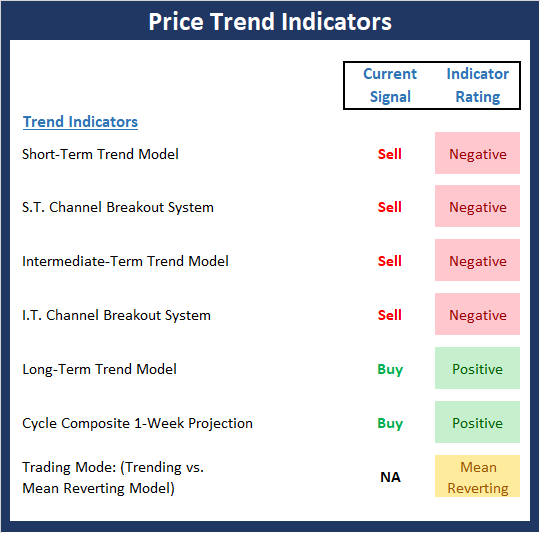
Once I’ve reviewed the big picture, I then turn to the “state of the trend.” These indicators are designed to give us a feel for the overall health of the current short- and intermediate-term trend models.
View Trend Indicator Board Online
The Bottom Line:
- The Trend board also provided a “heads up” that all was not well with the indicator world before the recent shellacking in stocks. Not surprisingly, this week’s board isn’t exactly a cheery sight. The cycle composite suggests some sideways-to-up movement to be followed by a retest down. P.S. the S&P 500 starts the week almost exactly in line with the cycle composite.
The State of Internal Momentum
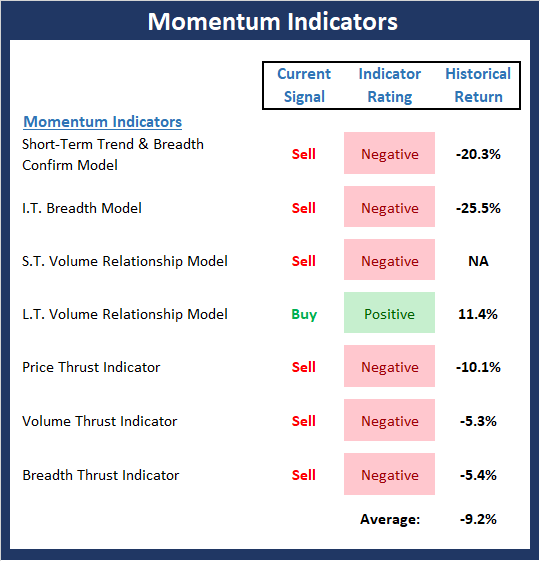
Next up are the momentum indicators, which are designed to tell us whether there is any “oomph” behind the current trend.
View Momentum Indicator Board Online
The Bottom Line:
- The Momentum board also should be credited with providing a warning that the major indices were due to falter. In short, the momentum indicators created classic divergences well in advance of the correction. Currently the board is, as you’d expect, negative.
The State of the “Trade”
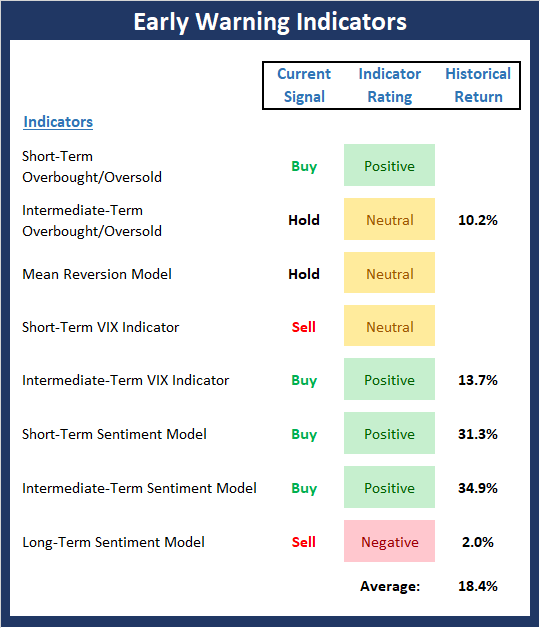
We also focus each week on the “early warning” board, which is designed to indicate when traders might start to “go the other way” — for a trade.
View Early Warning Indicator Board Online
The Bottom Line:
- The “Early Warning” board did its job by alerting us to the fact that the table had been set and that the bears were due to get in the game. As such, it is important to note that the board is now starting to swing the other way. This tells us that we should be alert for, at the very least, an oversold bounce.
The State of the Macro Picture
Now let’s move on to the market’s “environmental factors” – the indicators designed to tell us the state of the big-picture market drivers including monetary conditions, the economy, inflation, and valuations.
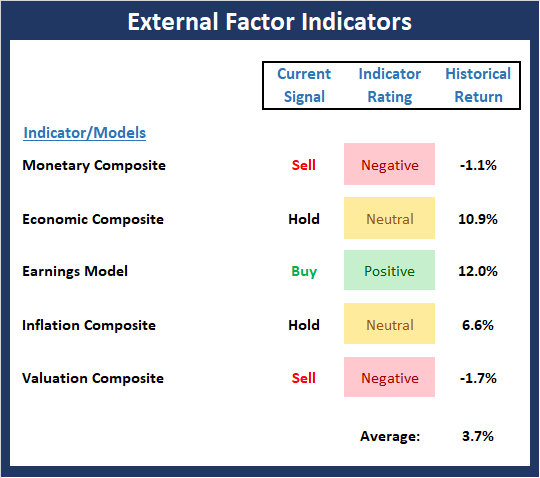
View Environment Indicator Board Online
The Bottom Line:
- The External Factors board, which did a very good job of alerting us to the fact that risk was high well before the correction began, continues to suggest that some caution remains warranted.
Thought For The Day:
Big shots are little shots that kept shooting. -Chistopher Morley
Be the first to comment