
The United States Department of Agriculture will release its August World Agricultural Supply and Demand Estimates report on Friday, August 10 at noon EST. The August report will offer a clear view of crop progress through the midpoint of the 2018 growing season in the United States and across the northern hemisphere.
Trade issues and weather conditions have impacted grain markets during the 2018 crop year. Soybean prices fell to their lowest level in a decade in July, but they have rallied back on the prospects of a trade deal with the European Union and a $12 billion bailout package for U.S. farmers impacted by the current trade dispute with China. The price of corn fell in sympathy with beans, but strength in the energy sector and a rebound in oilseed prices have supported the price of corn since the July WASDE report. Meanwhile, wheat has been a bullish beast rising to a new high for 2018 on the back of lower production from the European Union, Russia, and other world producers as weather conditions have been less than ideal for the primary ingredient in flour used to make bread.
Cotton prices are close to the 90 cents per pound level as we head into the report on Friday. Meanwhile, live cattle futures have recovered a bit since the last WASDE report, but they remained at the lowest level in years during the peak grilling season in 2018. Lean hog futures have been falling since the July report and are going into the offseason for demand at levels that could pose a challenge to the October 2016 bottom at 40.7 cents per pound.
Agricultural futures market typically become volatile going into and in the aftermath of the monthly report from the Department of Agriculture. The August report comes at the midpoint of the growing season for corn and beans, and near the end of the season in the wheat market. Therefore, it is likely that the supply and demand insights included in this month’s report will move markets and create price variance on Friday and into next week.
Trade issues continue to dominate price action
While the United States seems to be coming to terms with the European Union on trade, China continues to be a severe issue facing both nations and the world. The Chinese stock market has been falling, and China’s retaliation on U.S. agricultural commodity exports have been weighing on prices. Each year, the weather is typically the factor that determines the path of least resistance for prices of corn and soybean futures, this year trade has trumped the weather.
Soybeans recover
As China canceled the 2018 and 2019 shipment of U.S. soybeans last month, the price of the oilseed dropped like a stone to the lowest level in a decade. Source: CQG
As the daily chart of new crop November soybean futures on the CBOT highlights, the price of the oilseed dropped from highs of $10.6050 per bushel on May 29 to lows of $8.2625 on July 16, a decline of over 22%. However, news of a $12 billion bailout package for farmers hurt by the trade skirmish and potential sales to the European Union boosted prices back to just over the $9 per bushel level as of Thursday, August 9. FC Stone is projecting U.S. soybean yield of 51.5 bushels per acre versus the USDA’s forecast of 48.5 bushels per acre for a total production of 4.574 billion bushels versus the USDA’s July projection of 4.31 billion. A carryout projection by the USDA in Friday’s report of over 700 million bushels would likely cause nearby September bean futures to fall towards their recent decade low at $8.165 which was the July 16 low.
From a technical perspective, open interest in the soybean futures market has dropped from 867,153 contracts on July 23 to 793,430 contracts on August 8. The drop of 8.5% as the price moved from under the $8.70 level to over $9 per bushel is not a technical validation of the move to the upside in the soybean futures market. Additionally, price momentum has moved into overbought territory on the daily chart and has been flatlining. Beans hit a high of $9.2225 per bushel on July 31 which stands as the technical resistance level with support at the July 16 low at $8.2625 on the new crop November futures contract.
Corn reflects higher energy over recent weeks
Corn followed beans lower from the end of May until mid-July.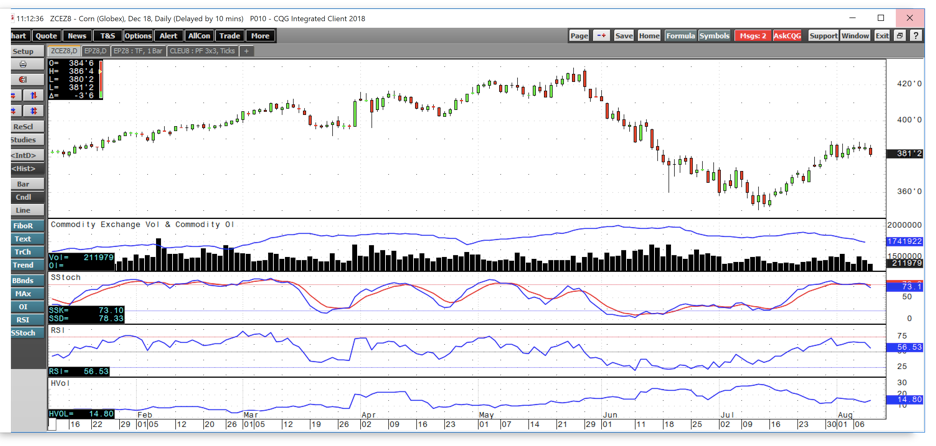
Source: CQG
As the daily chart of December CBOT corn futures illustrates, the price dropped from highs of $4.295 on May 24 to lows of $3.5025 on July 12, a decline of 18.5%. Corn recovered to highs of $3.885 on July 31 and was trading at the $3.8125 level on August 9. Corn recovered alongside soybeans.
FC Stone expects U.S. corn yield at 178.1 bushels per acre versus the USDA’s July forecast at 174 bushels per acre for a total production of 14.562 billion bushels versus the July WASDE projection of 14.23 billion bushels. The production increase would push U.S. corn ending stocks to 1.884 billion bushels, 325 million higher than the July WASDE report.
Corn open interest declined from 1.906 million contracts on July 24 when December corn was trading at under $3.70 per bushel to 1.742 million contracts on August 8 with corn at over the $3.80 level. The decline of 8.6% in open interest while the price rallied, is not a technical confirmation of the bullish move in the new crop corn futures market. Price momentum in corn has risen to an overbought condition which could mean the market is ripe for a downside correction in the aftermath of the WASDE report of the USDA meets or exceeds FC Stone’s projections. Technical resistance in December corn is at the $4.00 level with support at $3.5025 per bushel.
Wheat has been a bullish beast
At first, the price of September wheat futures on the CBOT fell in sympathy with soybean and corn markets as the price moved from $5.7075 on May 29 to lows of $4.7125 per bushel on July 11. The U.S. is not the world’s leader in wheat production and exports as it is in the corn and bean markets. Therefore, the trade issues have less impact on wheat prices than corn and the oilseed. 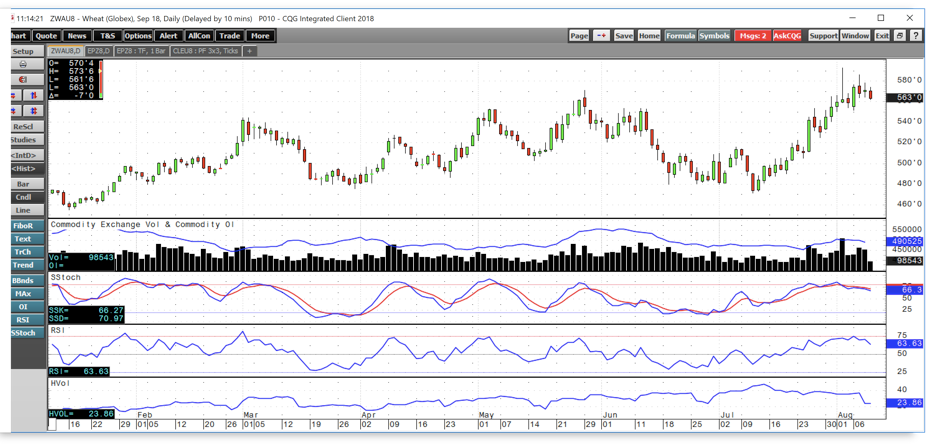
Source: CQG
Meanwhile, unlike corn and beans the price of wheat not only recovered, but it moved to a higher high at $5.93 per bushel on August 2 and has since declined to the $5.6325 per bushel level on August 9. Lower supplies from, Russia and the European Union have provided support for the price of wheat over recent weeks. Global pressures on supplies will likely cause the USDA to reshuffle demand flows in Friday’s WASDE report. Meanwhile, Russian wheat sales have been increasing over recent days, but persistent hot weather conditions and a lack of rain across many major growing areas in Russia and Europe is keeping prices high. Egypt and Turkey have slowed their buying of Black Sea wheat because of higher prices and have been reducing stocks. However, it is only a matter of time until these buyers come back to the market with significant purchases that could cause the price of wheat to move appreciably higher.
Open interest in the wheat futures market has been increasing moving from 452,132 contracts on July 24 when the price was at around the $5.10 level to 490,525 contracts on August 8 with September wheat at $5.63, a 8.5% increase in the metric. Rising price and increasing open interest provide technical support for the bullish trend in the wheat market. Technical resistance for September wheat is at the recent high at $5.93 with support at $4.7125 per bushel.
Finally, the KCBT-CBOT wheat spread as moved from a small discount for KCBT wheat to a 15 cents premium for KCBT wheat over recent sessions. A rise in the KCBT premium is typically a bullish sign for the commodity that is the primary ingredient in flour used to make bread.
Cotton sits near 90 cents and meats limp into the offseason
The cotton market is sitting at just over the 87 cents per pound level on the active month December futures contract as we head into the August WASDE report. 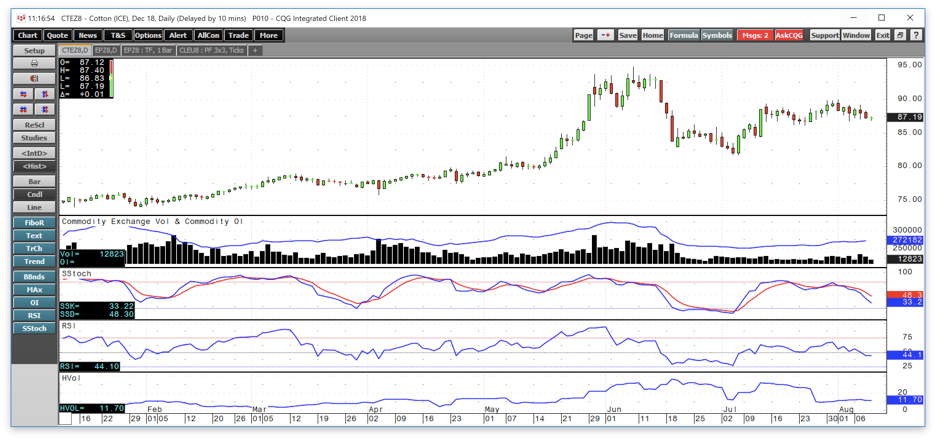
Source: CQG
In recent reports, the USDA reported that stocks are declining, production is a bit lower, and demand is higher for cotton around the world. Since lots of U.S. cotton flows to China, and Chinese garments flow back to the United States, cotton is an agricultural commodity that can also find itself in the crosshairs of the trade issue. Cotton was trading around the 87.25 cents per pound level on August 9. The market will be watching to see if the USDA continues to project increasing exports and a continuation in the decline of U.S. domestic and global stocks of the fluffy fiber. Support for December cotton futures is at the 81.75 cents per pound level with technical resistance at the June 8 high of 94.82 cents and the continuation contract peak at 96.50 cents per pound. Price momentum in cotton has crossed to the downside in neutral territory, and open interest has been gently rising over recent sessions.
When it comes to meats, hogs have suffered more under the weight of tariffs than cattle.
Source: CQG
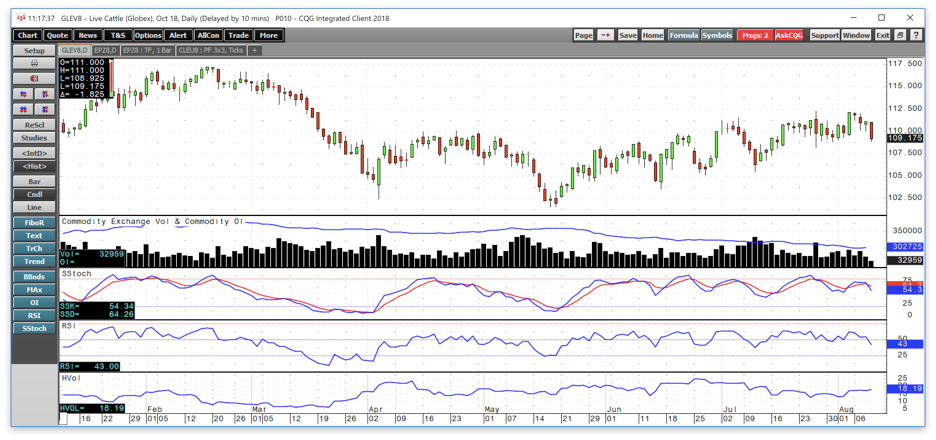
As the chart of the October live cattle futures contract shows, the price of beef for October delivery has been rising since the mid-May low at $1.015 per pound. October futures hit their most recent high at $1.1215 on August 3, which was just 0.10 cents under technical resistance, and were trading around the $1.09175 per pound level on August 9. Resistance is at $1.1725 the mid-February high with support a the May low. The USDA will provide data about slaughter rates and demand going into the offseason that begins after the Labor Day weekend in the United States. However, despite the bullish price trend over past months, beef prices were at the lowest level in years during the 2018 grilling season which is the peak time of demand in the U.S. each year. Trade issues likely weighed on the price of beef as demand for U.S. exports is one victim of trade disputes. Additionally, weak currency markets in Brazil and Argentina caused more selling of beef from these nations as their lower currency levels make their products more competitive in global markets.
Technical indicators show that live cattle are crossing lower in just below overbought territory. Open interest has been steadily declining since May which is likely a reflection of seasonal influences as the market moves from peak to offseason.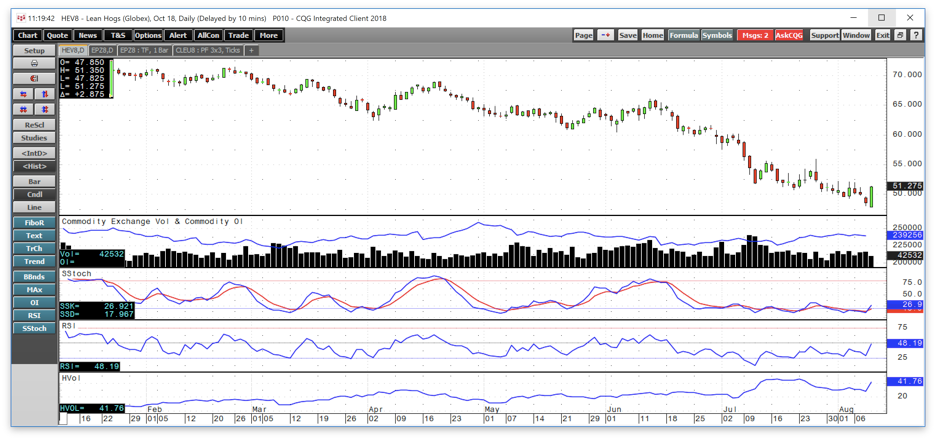
Source: CQG
Lean hogs are squarely in the crosshairs of trade as Mexico and China are significant importers of U.S. pork. The price of October lean hog futures has declined steadily falling throughout 2018 making lower highs and lower lows. The price of hogs for October delivery had dropped to a low of 47.825 cents per pound level on August 9 where technical support is now located. However, the market rejected that low and rose to over the 51 cents level in a bullish technical reversal pattern. Resistance is at the 66.125 cents level, the mid-June high on the October contract. The USDA will provide guidance on export data which could show a decline in demand for U.S. pork because of trade issues with both Chinese and Mexican buyers.
Open interest has been rising as the price of lean hogs decline which provides a technical confirmation of the bearish price trend. The price momentum metric had declined to oversold territory, which is a reason for the relief rally on Thursday. Meanwhile, it is possible that a bearish supply and demand picture could cause the price of lean hog futures to drop further. A challenge of the October 2016 low at 40.70 cents per pound which was the lowest price since the final quarter of 2002 could be in the cards for the pork market.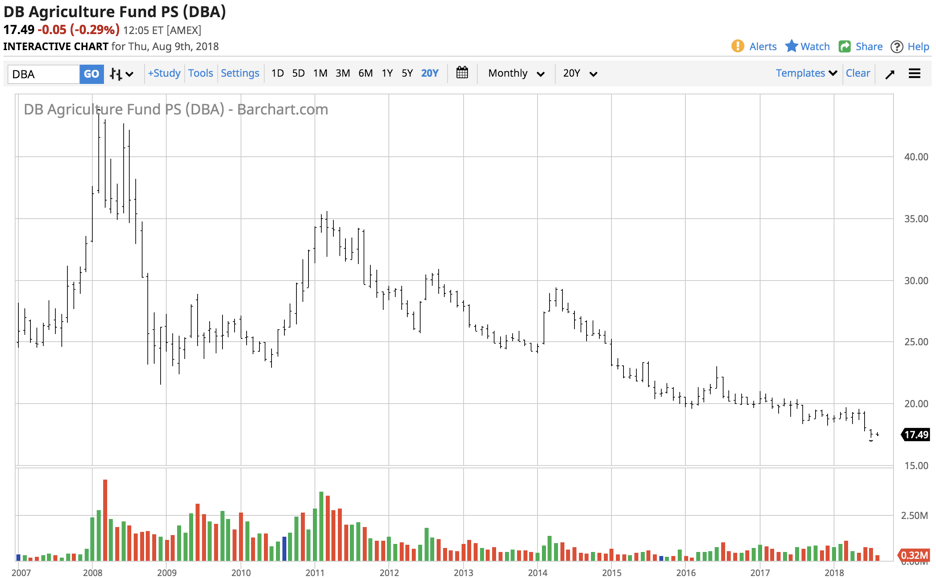
Source: Barchart
DBA is the Invesco DB Agriculture ETF product. As the chart shows, since 2007, DBA traded in a range from $17.23 to $43.50 per share. The price was trading near the lows of $17.49 on Thursday, August 9. The ETF has almost $700 million in net assets and trades an average of over 600,000 shares each day. The fund holds a diversified portfolio of positions in agricultural commodities futures including corn, soybeans, wheat, lean hogs, and live cattle.
The agricultural markets will hold their collective breath on Friday at noon EST as the USDA release is almost sure to cause volatility in the futures arena.
The Hecht Commodity Report is one of the most comprehensive commodities reports available today from the #2 ranked author in both commodities and precious metals. My weekly report covers the market movements of 20 different commodities and provides bullish, bearish and neutral calls; directional trading recommendations, and actionable ideas for traders. More than 120 subscribers are deriving real value from the Hecht Commodity Report.
Disclosure: I/we have no positions in any stocks mentioned, and no plans to initiate any positions within the next 72 hours.
I wrote this article myself, and it expresses my own opinions. I am not receiving compensation for it (other than from Seeking Alpha). I have no business relationship with any company whose stock is mentioned in this article.
Additional disclosure: The author always has positions in commodities markets in futures, options, ETF/ETN products, and commodity equities. These long and short positions tend to change on an intraday basis.
Be the first to comment