Introduction
The opportunities in closed-end funds over the last few months caught the eye of many investors. Most of these products are designed to provide a steady stream of income, usually on a monthly or quarterly basis, as opposed to the biannual payments provided by individual bonds. And this feature continues to attract market participants even when the overall market looks unstable.
In spite of CEFs being mostly of interest to income investors, we have found our path to approach them as active traders and we are constantly monitoring them. As a testament to this, you will be kept up to date with Weekly Reviews such as the one below.
The Benchmark
Source: Barchart, iBoxx $ High Yield Corp Bond iShares
The main index for high-yield closed-end funds is the iShares iBoxx $ High Yield Corporate Bond ETF (NYSEARCA:HYG). Another positive week for the main benchmark after the sharp decline which we saw at the end of June. On a weekly basis, we observe an increase of $0.28.
The situation in the sector remains stable and since the beginning of the year, the main index is trading in a price range which can be easily seen on the chart above. We do not need to use any technical tools to recognize it. Currently, everything seems predictable. If there is no fundamental reason behind some of the significant changes in the price, the active traders can even try to trade them using the support or the resistance levels.
For the long-term investors, the sector opened up opportunities to buy funds at discount and throughout the article, we are going to review them.
In my summary, I am going to briefly cover several advantages of high-yield bonds and respectively closed-end funds, which invest in this asset class. As the high-yield sector generally has a low correlation to other sectors of the fixed income market, along with less sensitivity to interest rate risk, an allocation to high-yield bonds may provide portfolio diversification benefits. In addition, high-yield bond investments have historically offered similar returns to equity markets, but with lower volatility.
Statistical Comparison And Spread Review Of The Sector
The spread is simply the compensation a bond investor receives over the risk-free rate, which in this case is the U.S. Treasury rate. On a weekly basis, we notice a decrease of 0.13 bsp. As we can see, the current levels are significantly lower compared to the ones of the financial crisis.
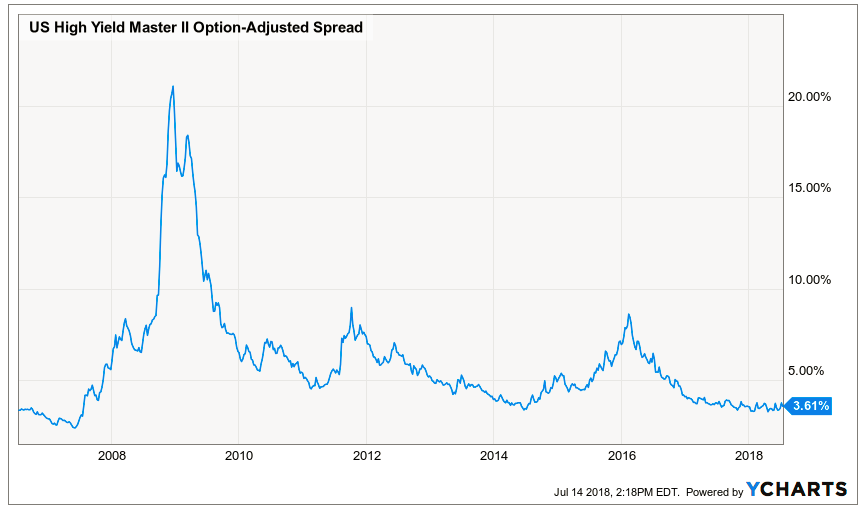
Source: YCharts, US High Yield Master II Option-Adjusted Spread
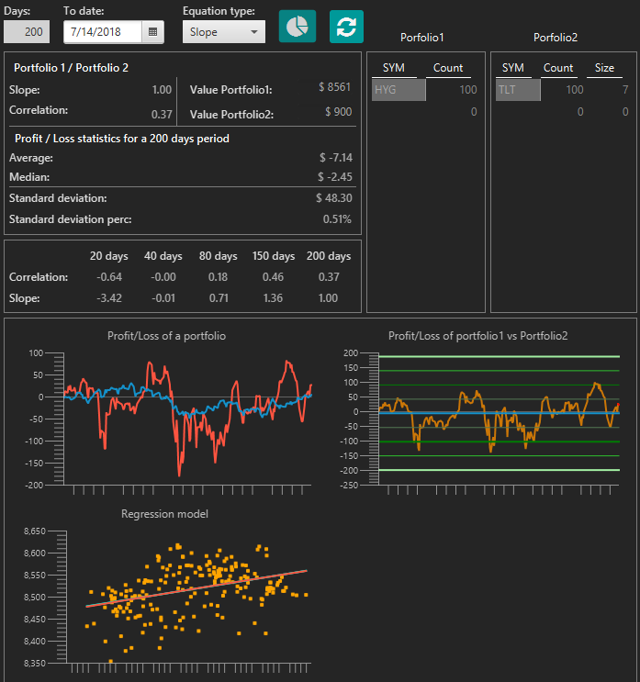
Below, you can find a statistical comparison between the iShares iBoxx $ High Yield Corporate Bond ETF and the iShares 20+ Year Treasury Bond ETF (NYSEARCA:TLT). As discussed, we observe a low correlation between these two sectors. It is only 0.37 points for the last 200-day period:
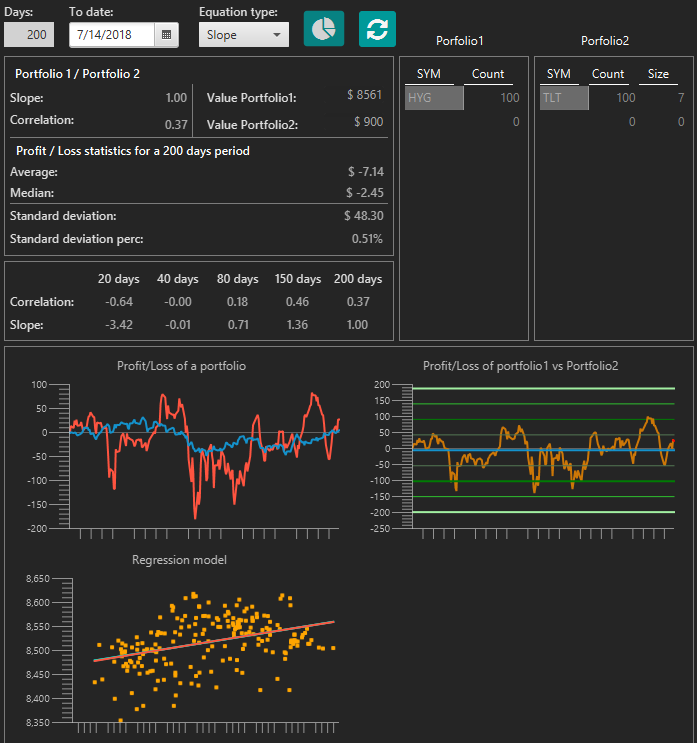
Source: Author’s software
The News

Source: Yahoo News, High Yield Closed-End Funds News
Over the past week, there were no interesting news for the sector. Only PGIM Investments announced that will host a conference call to provide market commentary and product updates for:
- Prudential Short Duration High Yield Fund (NYSE:ISD)
- Prudential Global Short Duration High Yield Fund, Inc. (NYSE:GHY)
On the call, they will discuss the performance of the funds and the high yield sector.
Review Of High-Yield CEFs
1. Lowest Z-Score:
Source: CEFConnect.com
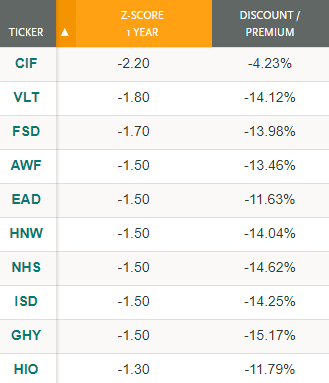
The first criteria which I am going to use is a statistical one. The Z-score indicator shows us how many times the discount/premium deviates from its mean for a specific period. By the value of the Z-score, we can figure out whether the fund is overpriced or undervalued.
Once again, MFS Intermediate High Income Fund (NYSE:CIF) has the lowest Z-score in the sector. This is the only fund that has crossed the border of -2.00 points. The sell-off can be easily explained by the recent dividend cuts and the negative UNII balance per share.
Invesco High Income Trust II (NYSE:VLT) is taking the second position of the ranking. Here, we have the needed statistical edge and an attractive discount. Additionally, the fund distribution rate is pretty stable despite the negative UNII balance per share. As a drawback, I consider its relatively low daily volume of 17,000 shares per day.
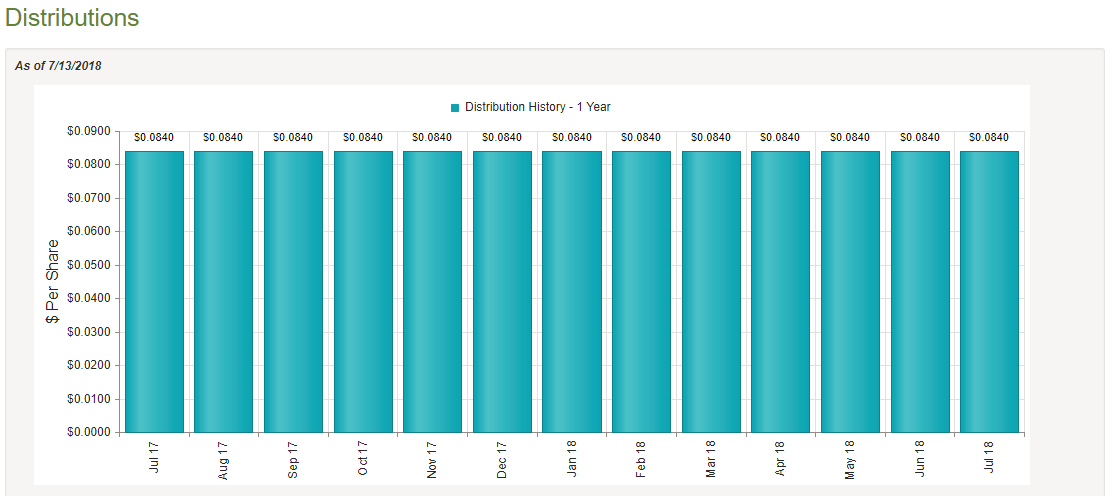
Source: CEFConnect.com, Invesco High Income Trust II
2. Highest Z-Score:
Source: CEFConnect.com
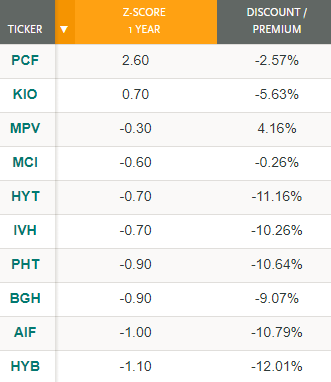
Reversely, if we are looking for potential “Short” candidates, we need to sort the funds by the highest Z-score. It does not make sense to use the indicator if its value is between 0 and 1 point. In that scenario, we cannot talk about a statistical edge.
Putnam High Income Securities Fund (NYSE:PCF) has relatively high Z-score compared to the rest of the CEFs. PIMCO funds are the ones which the market recognize as the valuable, therefore to sell them we need to have a really high premium or to catch their dividend cut. Currently, we do not have such kind of situation.
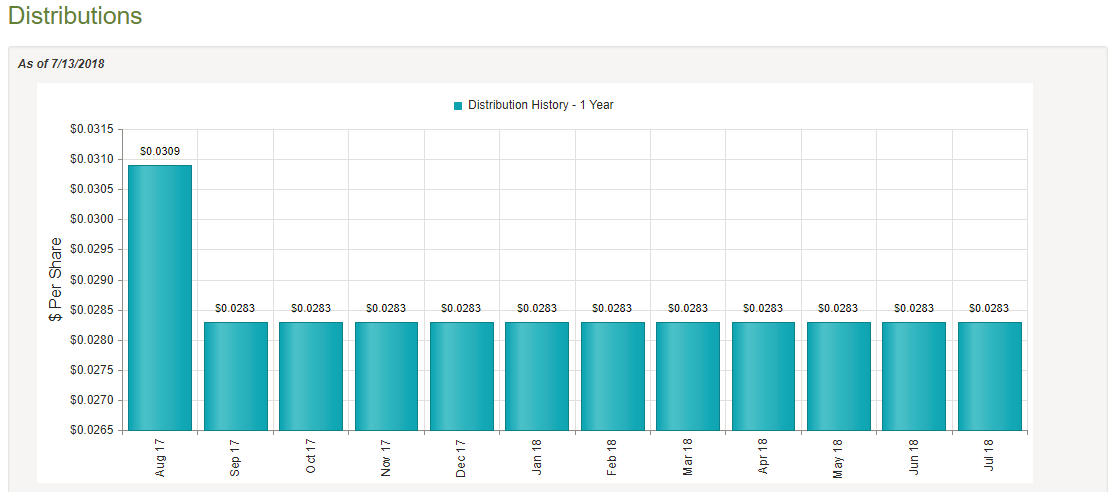
Source: CEFConnect.com, Putnam High Income Securities Fund
3. Biggest Discount:
Source: CEFConnect.com
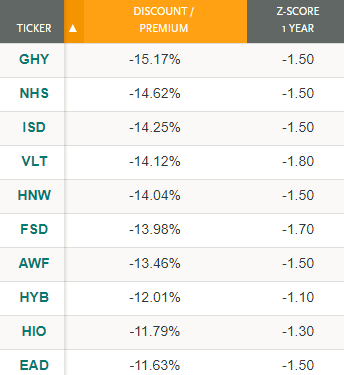
Another important metric which I always include in my analysis is the spread between the price and the net asset value of the funds. Following the logic, when we are looking for “Buy” opportunities, we care about the discount of the closed-end funds.
The above table is comprised of funds with an attractive discount and can be used as a starting point of your analysis. On a weekly basis, we do not have any significant changes among the participants.
Prudential Global Short Duration High Yield Fund (GHY) continues to keep the position of a chart leader and it is even increasing its discount. The NAV of the fund kept its levels, but the price has decreased by $0.07 on a weekly basis.

Source: CEFConnect.com, Prudential Global Short Duration High Yield Fund
4. Highest Premium:
Source: CEFConnect.com
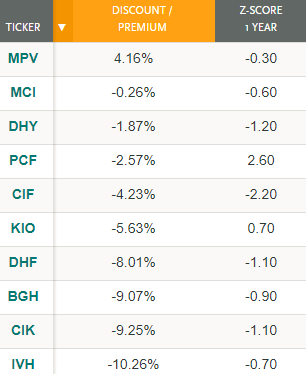
Here, I am looking for potential “Shorts” based on their premiums and statistical performance. The situation remains the same as we used to see it over the last months. The seeking of “Sells” is still a challenging task and the sample above proves it. Even though Barings Participation Invs (NYSE:MPV) is trading at a premium I do not find a statistical edge to review it.
5. Highest 5-year Annualized Return On NAV:
Source: CEFConnect.com
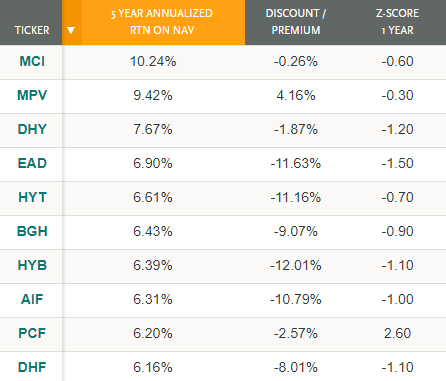
The above funds are the ones with the highest return on NAV for the past five years. Currently, only Wells Fargo Advantage Income Opportunities Fund (NYSEMKT:EAD) provide us with a reasonable statistical edge. The satisfying return is accompanied by a discount of 11.63%. It seems like a potential “Buy” candidate.
6. Lowest 5-year Annualized Return On NAV:
Source: CEFConnect.com
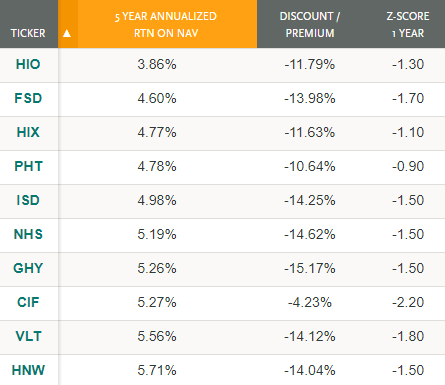
Here, we have the closed-end funds with the lowest return on net asset value. If you are not a fan of the leveraged funds you may decide to review the Western Asset High Income Opportunity Fund (NYSE:HIO). It has an attractive discount and is one of the two funds which are non-leveraged.
7. Highest Distribution Rate:
Source: CEFConnect.com
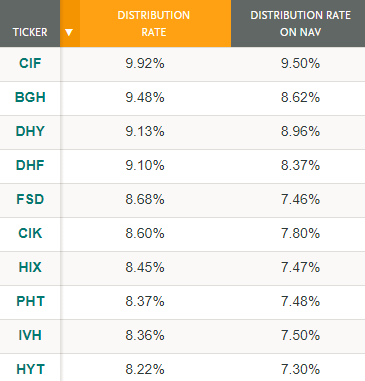
Most of the investors want to see what is the actual distribution performance of the fund based on its price. The above table provides us with information about the highest distribution rate in the sector. Additionally, I included another important metric: the annualized distribution rate on the net asset value. The ranking is more static, and on a weekly basis, we do not see so many changes.
Despite the recent dividends cuts, MFS Intermediate High Income Fund has the highest distribution rate on price and on NAV.
8. Lowest Distribution Rate:
Source: CEFConnect.com
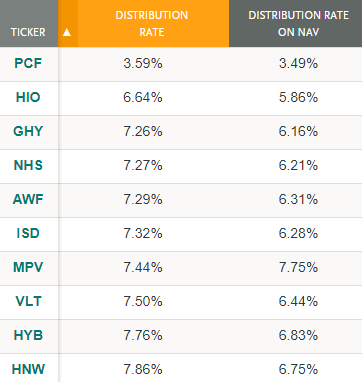
We have already discussed Putnam High Income Securities Fund. Its distribution rate is the lowest one – only 3.59%. Definitely, this seems extremely low compared to the rest of the funds. Be aware that the first two funds from the observation are non-leveraged ones.
9. Lowest Effective Leverage:
Source: CEFConnect.com
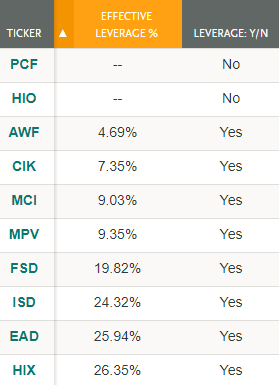
Here, we can see the big picture. We have two funds, which are not leveraged and four, which use a leverage below 10%.
Statistical Comparison And Potential Trades
As usual, I am looking for closed-end funds that have all the characteristics to be of interest to us. Based on the current market environment, it is easier to find eventual “Buys” rather than reasonable “Shorts.”
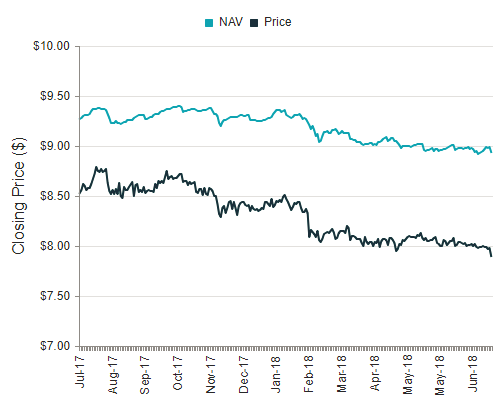
The fund which I am going to review today is Wells Fargo Advantage Income Opportunities Fund (NYSEMKT:EAD). It has one of the highest return on net asset value for the past five years. The attractive discount and relatively low Z-score for the sector make me think it is worth it to include to my potential “Buy” candidates list.

Source: CEFConnect.com, Wells Fargo Advantage Income Opportunities Fund
Source: Fund Sponsor Website
Source: CEFConnect.com, Wells Fargo Advantage Income Opportunities Fund
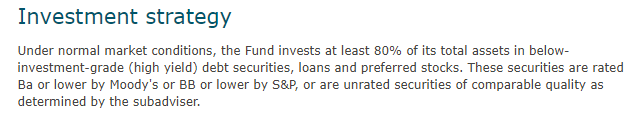
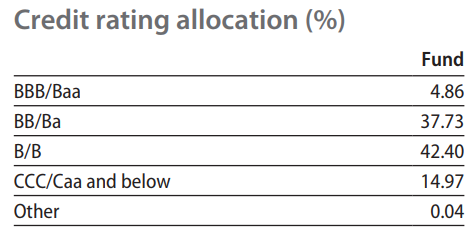
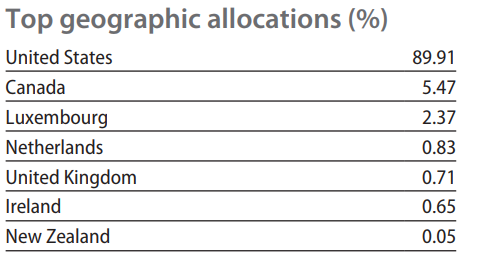
The fund has an average daily volume of 202,000 shares per day, so you do not need to worry about its liquidity. The portfolio information is showing us that the quality meets the requirements that most of us want to see. The main distribution is between “B” and “BB” ratings. The assets from issuers located in the United States are 89.91%, and the Energy sector has the biggest weight.
Source: Fund Sponsor Website
Source: Fund Sponsor Website
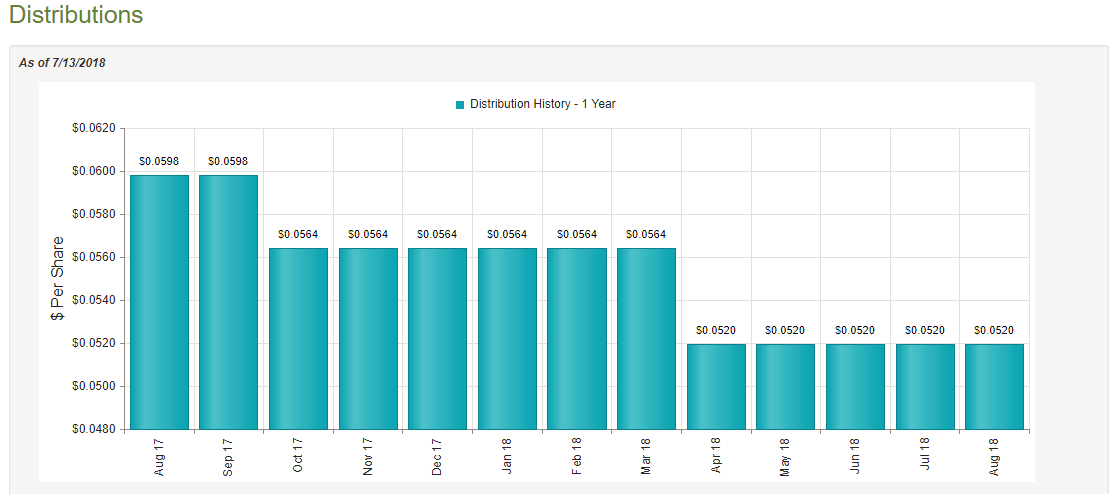
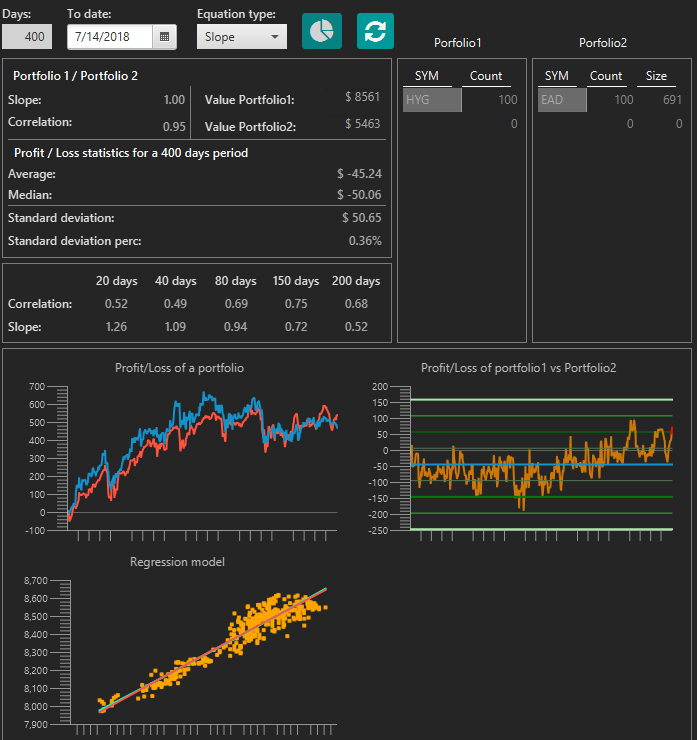
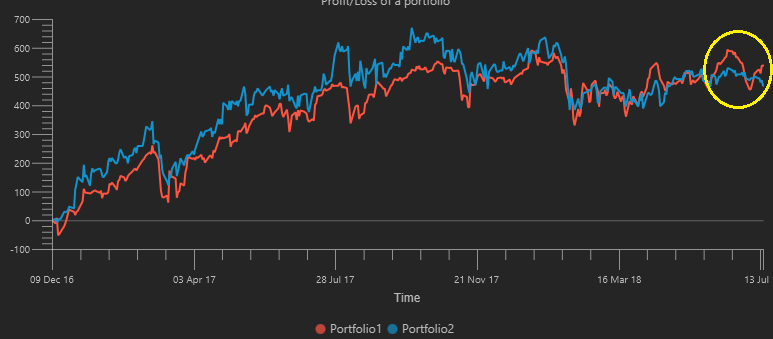
The dividend was decreased in April, and the current distribution is $0.0520 per share. Below you can find as well the statistical comparison between iShares iBoxx $ High Yield Corporate Bond ETF and Wells Fargo Advantage Income Opportunities Fund.
Source: CEFConnect.com, Wells Fargo Advantage Income Opportunities Fund
Source: Author’s software
Source: Author’s software
Conclusion
The high-yield sector does not provide us with significant arbitrage opportunities at present. Most of the CEFs are traded at discounts and it is difficult to find reasonable “Short” candidates. If we see a break in the support or the resistance of the current trading range, we expect significant changes in the funds’ statistical characteristics.
Based on the data that I have reviewed, EAD can be a potential addition to your portfolio.
Note: This article was originally published for our subscribers on 7/15/2018, and some figures and charts may not be entirely up to date.
Trade With Beta
At ‘Trade With Beta‘ we also pay close attention to Closed-end Funds and are always keeping an eye on them for directional and arbitrage opportunities created by market price deviations. As you can guess, timing is crucial in these kinds of trades; therefore, you are welcome to join us for early access and the discussions accompanying this kind of trades
Disclosure: I/we have no positions in any stocks mentioned, but may initiate a long position in EAD over the next 72 hours.
I wrote this article myself, and it expresses my own opinions. I am not receiving compensation for it (other than from Seeking Alpha). I have no business relationship with any company whose stock is mentioned in this article.
Be the first to comment