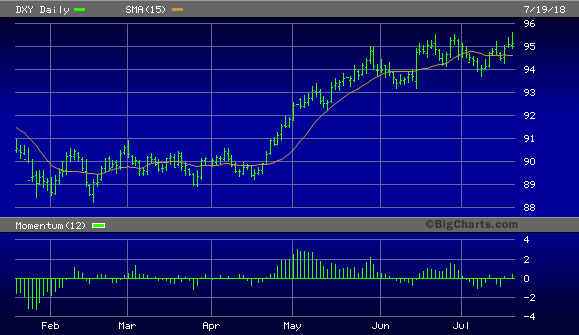
The inflation which many believed would result from the U.S.-China tariff dispute is nowhere apparent. In fact, the opposite has occurred as the U.S. dollar has strengthened while the trade war has accelerated. Meanwhile, U.S. bond yields have remained subdued as inflation remains nowhere in sight. In this commentary, we’ll look at how the tariff war is actually benefiting the U.S. bond market and why bond prices should remain energized in the near term.
Ever since the trade war escalated earlier this spring, bond investors have feared the return of inflation. The commonly held belief is that higher tariffs will lead to higher prices and lower growth for the U.S. and even risks tipping the U.S. economy into recession, as this recent Associated Press article states. Investors also fear that U.S. Treasury bonds will be spurned by foreigners, who will reduce their purchases of U.S. debt in response to President Trump’s protectionism.
Yet, to date, foreign investors have responded to the tariff war by increasing their purchases of U.S. sovereign and corporate debt. Corresponding with the increased demand for U.S., bonds have been a powerful rally in the U.S. dollar index (DXY), shown below. One consequence of the trade war has been renewed and accelerating weakness in the stock, currency, and bond markets of several trade-dependent foreign nations, including China’s. With long-term Treasury bonds in the U.S. yielding 2.84%, this yield is very attractive to foreign investors – especially when the dollar is strong. As Ed Yardeni noted in a recent blog, “When investors turn defensive and want to park their money in a safe asset, the US Treasury bond clearly offers a more attractive return than bunds and [Japanese Government Bonds].”
Source: BigCharts
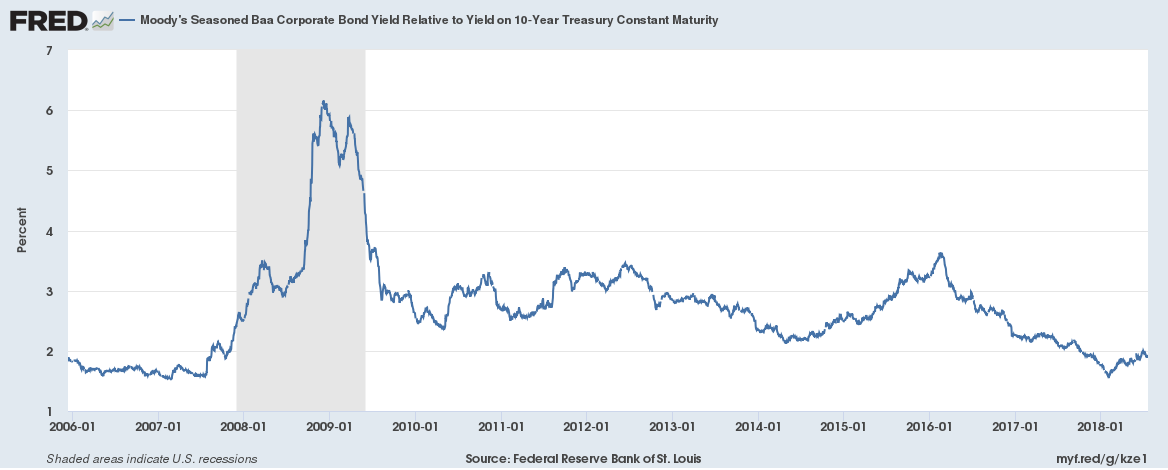
Meanwhile, credit spreads remain subdued, which suggests that bond market investors don’t foresee a recession risk for the U.S. resulting from a trade war with China. Shown here is the Moody’s Seasoned Baa Corporate Yield relative to the U.S. 10-year Treasury bond. This graph illustrates the tendency for credit spreads to widen when recession risk is at its highest. This happened immediately prior to the 2008-2009 recession as well as the mini-bear market and U.S. economic slowdown in 2015 – early 2016.
Source: St. Louis Fed
In total contrast to the previous periods of rising credit risk, credit spreads remain suppressed and are much closer to their 10-year lows than the previous peaks in 2008 and 2016. This means bond investors aren’t expressing fear and uncertainty for the future state of the U.S. economy and consider domestic bonds a relatively safe investment choice when compared with foreign bonds.
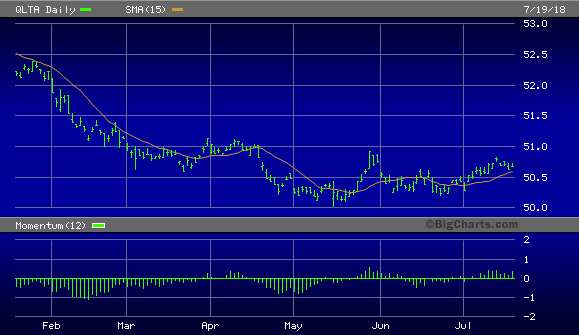
While high-quality U.S. corporate bond prices tumbled earlier this year when investors feared the worst for the U.S. in a trade war with China, corporate bonds have been recovering in recent months. As investors realize the U.S. is more likely than China to win in a trade dispute, and as foreign “hot money” flows into the U.S. financial market, high-quality corporate debt demand has increased. Shown here is the graph of the iShares AAA-A Rated Corporate Bond ETF (QLTA), which illustrates the bottoming process since May.
Source: BigCharts
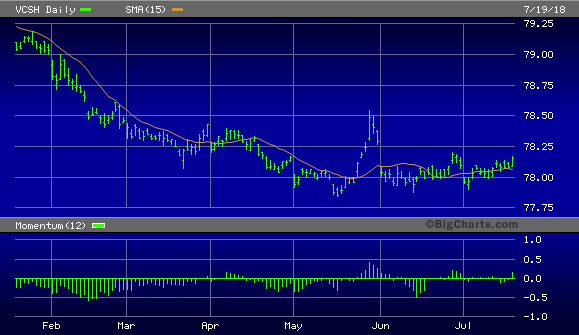
Shown below is the Vanguard Short-Term Corporate Bond ETF (VCSH), which is a useful way of evaluating the demand for short-term corporate debt. VCSH established a low for the year on May 16 at the 77.85 level. Historically, a confirmed bottom in VCSH has served as a precursor to strength in U.S. Treasury bond prices. However, with T-bonds showing relative strength versus corporate bonds, as long as VCSH remains about its year-to-date low and merely stabilizes rather than strengthens, that should be enough to allow Treasury bond prices to remain buoyant.
Source: BigCharts
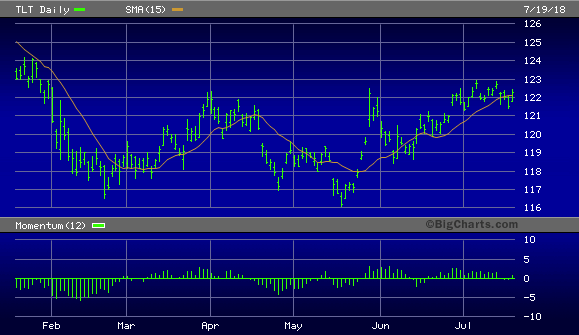
Long-dated U.S. Treasury bonds have especially benefited from the flight-to-safety among global investors in the wake of the trade war. Shown here is the widely followed iShares 20+ Year Treasury Bond ETF (TLT), which serves as a useful proxy for U.S. long-term bond prices. TLT remains near its 6-month high and has established a short-term (1-3 month) rising trend. A breakout above the pivotal 123.00 level would technically pave the way for a measured move to the December 2017 chart resistance zone between 127.00 and 128.000.
Source: BigCharts
Price predictions are a guessing game and are really beyond the scope of sound market analysis. What’s important for traders and investors alike is the dominant direction, not the magnitude, of market moves. Right now the short-term trend for U.S. Treasury bond market is up and should remain bullish while the trade war continues. The “fear factor” generated by the uncertain outcome of the trade dispute as it primarily concerns China and other trade-dependent nations is that has boosted U.S. Treasury demand. There is no reason to assume a diminution of that demand in the near term. Thus, Treasuries remain a bullish bet this summer.
On a strategic note, short-term bond traders can continue to remain long the TLT as long as it remains above the 120.00 level and the short-term corporate bond ETF remains above its aforementioned May 16 low of 77.85. I also recommend that long-term investors remain underweight Treasuries and allocate most of their portfolio to stocks which have more long-term upside potential than T-bonds.
Disclosure: I am/we are long XLK, IYR.
I wrote this article myself, and it expresses my own opinions. I am not receiving compensation for it (other than from Seeking Alpha). I have no business relationship with any company whose stock is mentioned in this article.
Be the first to comment