CRUDE OIL & GOLD TALKING POINTS:
- Crude oil prices erase gains inspired by EIA data, Saudi shipment pause
- Gold prices mark time before FOMC meeting, Treasury debt issue plans
- Kneejerk price volatility may fizzle without follow-though in the near term
Crude oil prices turned lower Friday, with the WTI benchmark erasing gains scored over the preceding 48 hours on the back of an unexpectedly large inventory drawdown and a disruption of Saudi shipments through the Bab el-Mandeb Strait. The swift reversal may speak to traders’ unwillingness to bet big on shorter-term developments and opting to focus on larger themes (like a looming US/China trade war, for example).
Meanwhile, gold prices continued to mark time in familiar territory. Here too, investors may have been reluctant to show conviction before incoming FOMC rate decision. The US Treasury will also unveil its latest borrowing plans. An increase in debt issuance may compound upward pressure on borrowing costs from tightening monetary policy, sapping the appeal of non-interest-bearing assets like the yellow metal.
COMMODITIES AWAIT CRITICAL NEWS FLOW
Consolidation may persist in the near term. Top tier scheduled event risk doesn’t enter the picture until Tuesday when the EIA publishes a monthly report on crude oil production while API offers up a private-sector estimate on weekly US inventory flows. In the meantime, elevated sensitivity to headline risk might make for kneejerk volatility but lasting follow-through could be too much to ask for.
See our guide to learn about the long-term forces driving crude oil prices!
GOLD TECHNICAL ANALYSIS
Gold prices are still drifting above the 38.2% Fibonacci expansionat 1217.29. A break below this barrier confirmed on a daily closing basis targets the 50% levelat 1202.28. Alternatively, a push above support-turned-resistance at 1236.66 paves the way for a retest of the 1260.80-66.44 area.
CRUDE OIL TECHNICAL ANALYSIS
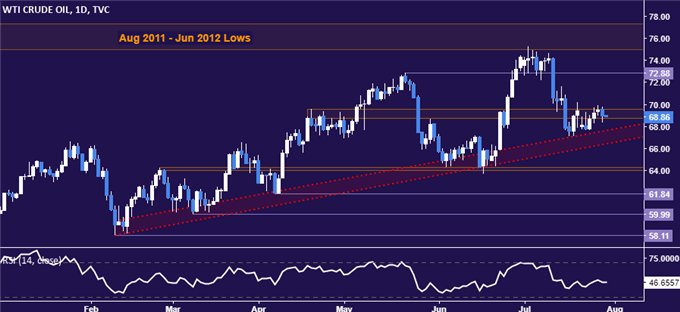
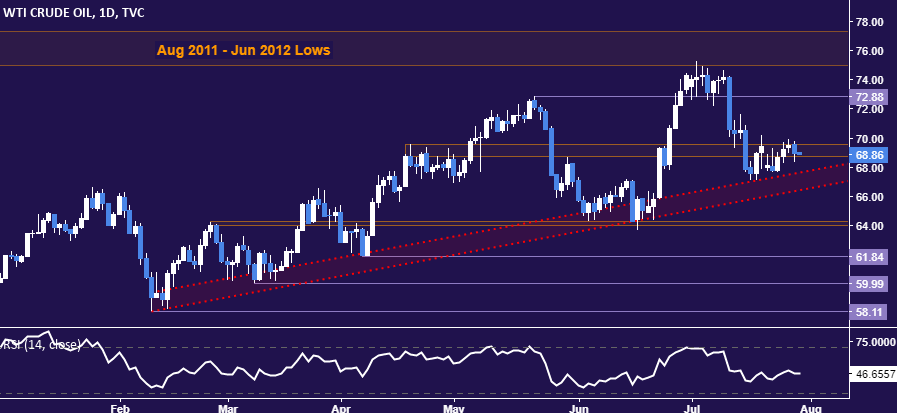
Crude oil prices continue to struggle for clear-cut direction below the $70/bbl figure. A daily close below trend support set from in early February – now at 66.38 – exposes the 63.96-64.26 area. Alternatively, a breach of resistance in the 68.74-69.53 opens the door for a foray back above the $72/bbl figure.
COMMODITY TRADING RESOURCES
— Written by Ilya Spivak, Currency Strategist for DailyFX.com
To contact Ilya, use the comments section below or @IlyaSpivak on Twitter
Be the first to comment