
(Source: imgflip)
The core strategy of my dividend high-yield, dividend growth retirement portfolio is to own quality stocks with strong track records of delivering consistent payout growth in all manner of economic, industry, and interest rate environments.
Recently, I was asked to write an article highlighting low-risk yieldCos, or renewable energy utilities. Specifically, the ones that would hold up well during the next recession, which might be potentially coming as early as 2020. The two that immediately popped to mind are industry leaders Brookfield Renewable Partners (NYSE:BEP), and NextEra Energy Partners (NYSEMKT:NEP).
Let’s take a look at why BEP and NEP are two great choices for high-yield income growth investors looking to safely ride out the next recession, while simultaneously cashing in on the strong secular growth trend that is renewable energy. Specifically, find out why, at today’s attractive valuations, both stocks are likely to deliver strong, market-beating total returns over the coming decade.
Brookfield Renewable Partners: The Blue Chip Of The YieldCo Industry Continues To Grow Quickly
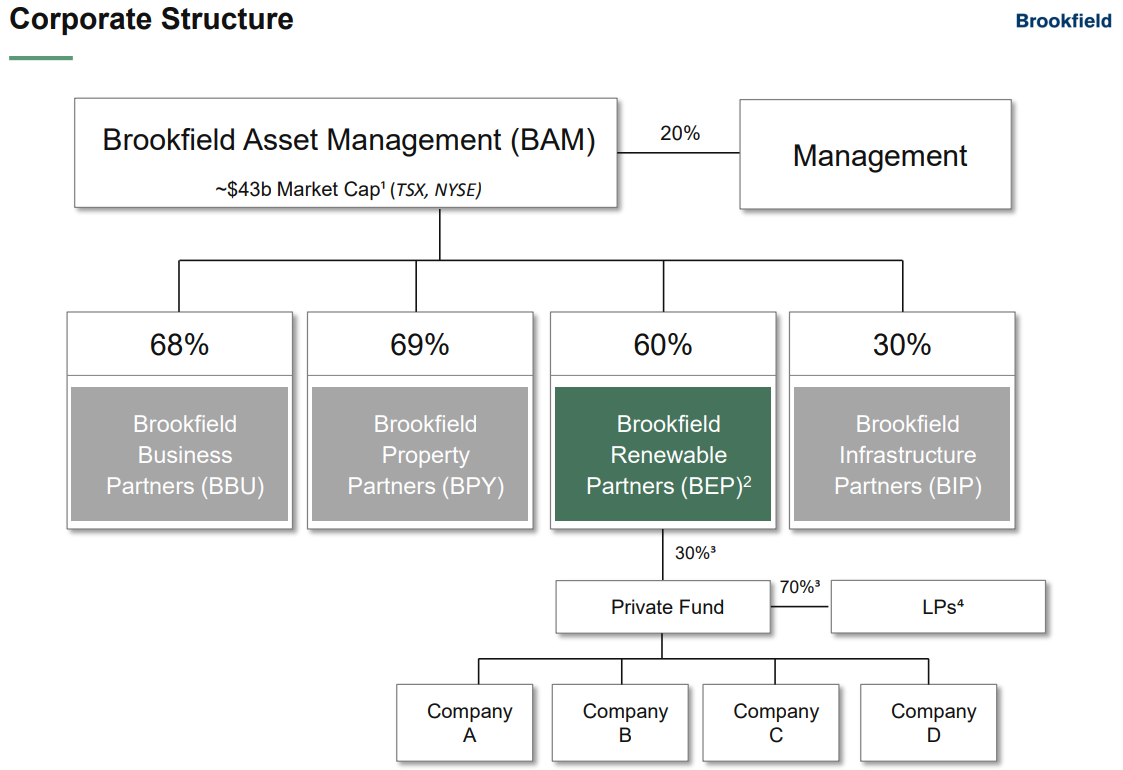
Brookfield Renewable Partners is one of several limited partnerships (they issue K-1 forms) managed by Brookfield Asset Management (NYSE:BAM). BAM is the world’s largest infrastructure/hard asset manager with:
- 115 years of operational history
- $285 billion in assets under management
- 100 offices in over 30 countries
- A total employee count of over 80,000 across five continents
(Source: BEP investor presentation)
The way it works is that Brookfield Renewable Partners raises external debt and equity capital from investors attracted to its high and steadily growing distributions. Since 2012, BEP has raised over $3 billion in accretive equity capital, which has been leveraged with mostly non-recourse project-level debt to fund power generation expansion of 12.1 GW.
It acquires partial or full positions in deals BAM puts together to buy or invest in undervalued wide-moat, cash-rich, renewable energy assets around the world. BAM charges a management fee of 1.25% of assets and owns the LP’s incentive distribution rights or IDRs. These grant it 25% of BEP’s marginal distributions going forward. And because BAM owns 60% of BEP’s limited units (what investors own), this creates a power incentive for BAM to continue growing BEP in a fast, but sustainable, manner. Specifically, BAM has provided BEP over 140 executives and 2,000 employees operating out of 4 regional control centers.
(Source: BEP investor presentation)
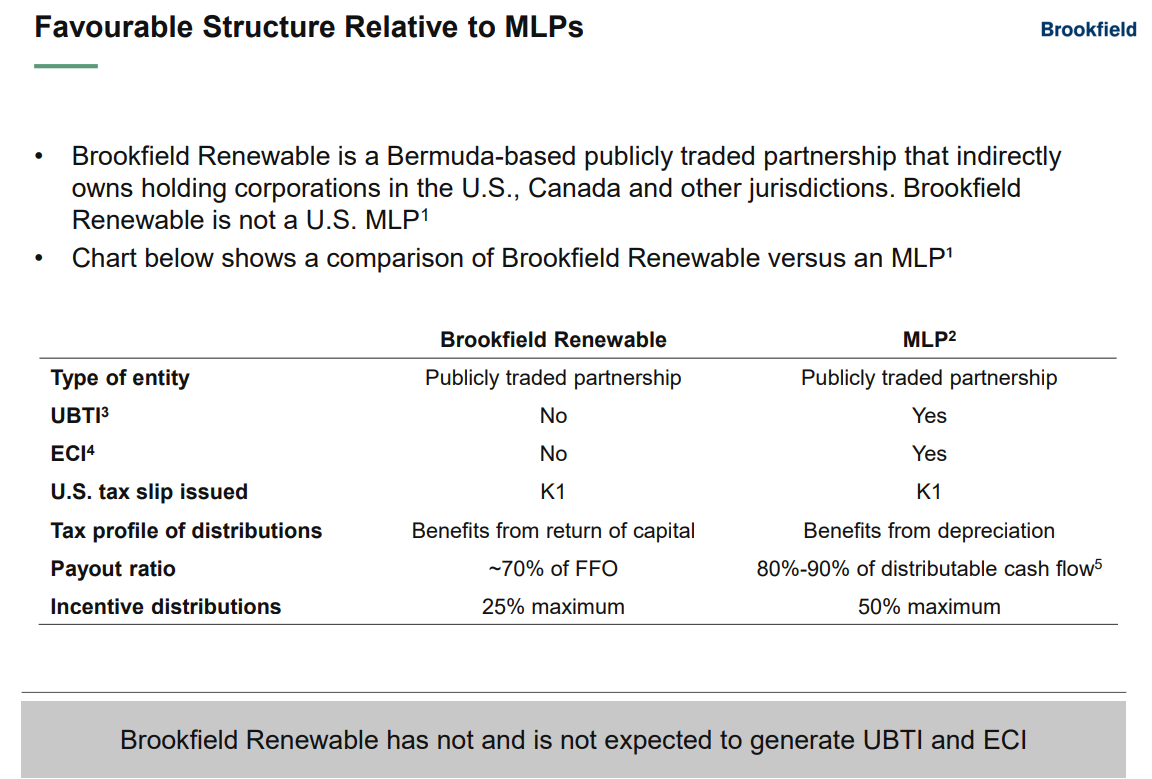
Effectively, BEP is similar to an MLP, but with some key differences. The main ones are that it has a much lower IDR threshold (half that of MLPs that still have IDRs) and doesn’t generate unrelated business taxable income, or UBTI. That’s due to being structured mostly as an LP whose assets are themselves LPs. In other words, because BEP’s assets pass-through cash flow to it, and it passes that onto investors, no UBTI is usually generated and BEP can safely be held in retirement accounts, such as Roth IRAs, IRAs, and 401(k)s.
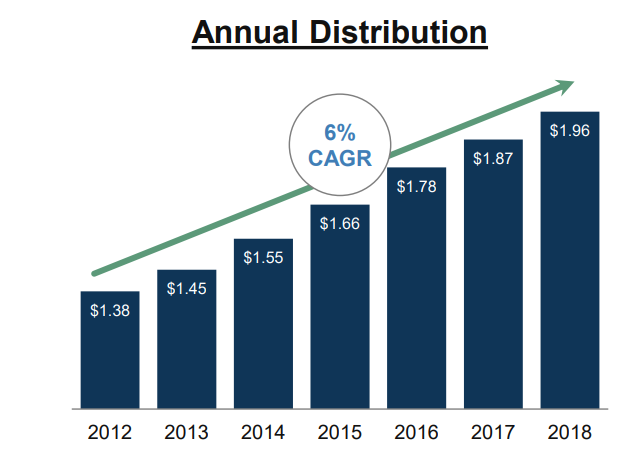
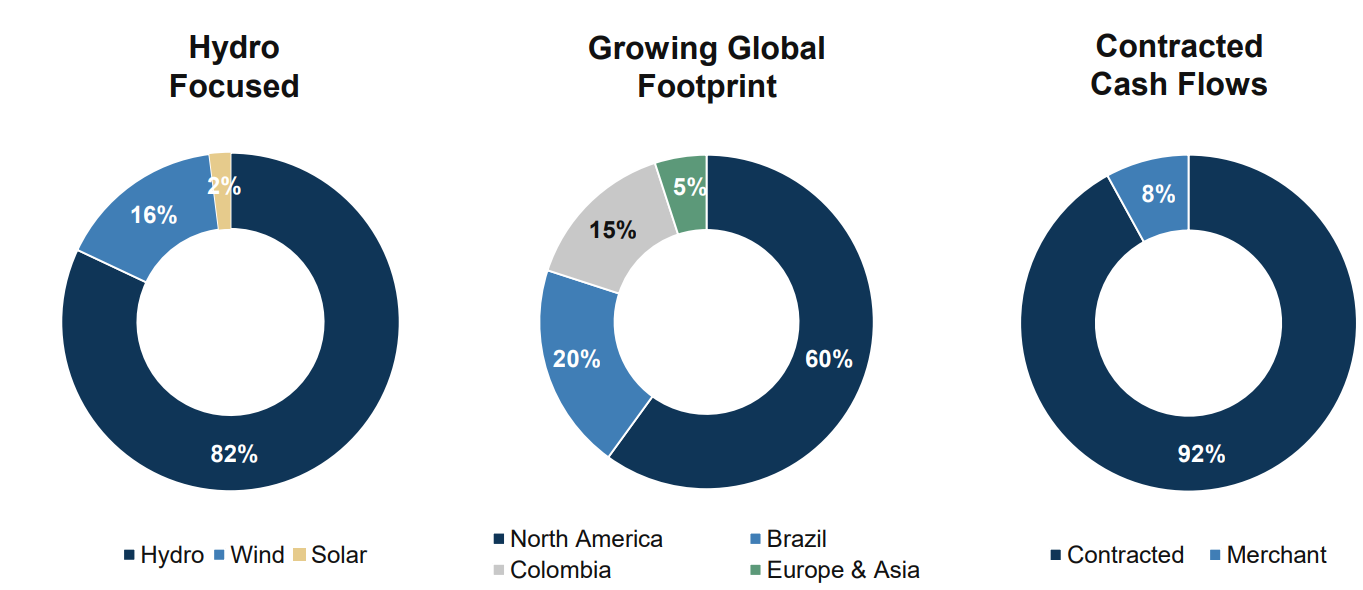
The power generation of BEP’s assets are under long-term, fixed-rate (and inflation-adjusted) power purchases agreements, or PPAs. The counter-parties are usually investment-grade, regulated local utilities, which means low counter-party risk of contract default. These low-risk contracts make up 92% of BAM’s funds from operation, or FFO (it’s equivalent to free cash flow and is what funds the distribution). The highly stable nature of its cash flow, combined with rapid asset expansion courtesy of BAM’s large deal flow, has allowed BEP to generate highly consistent payout growth over the years, including during the sharp yieldCo bear market of 2015-2016.
(Source: BEP investor presentation)
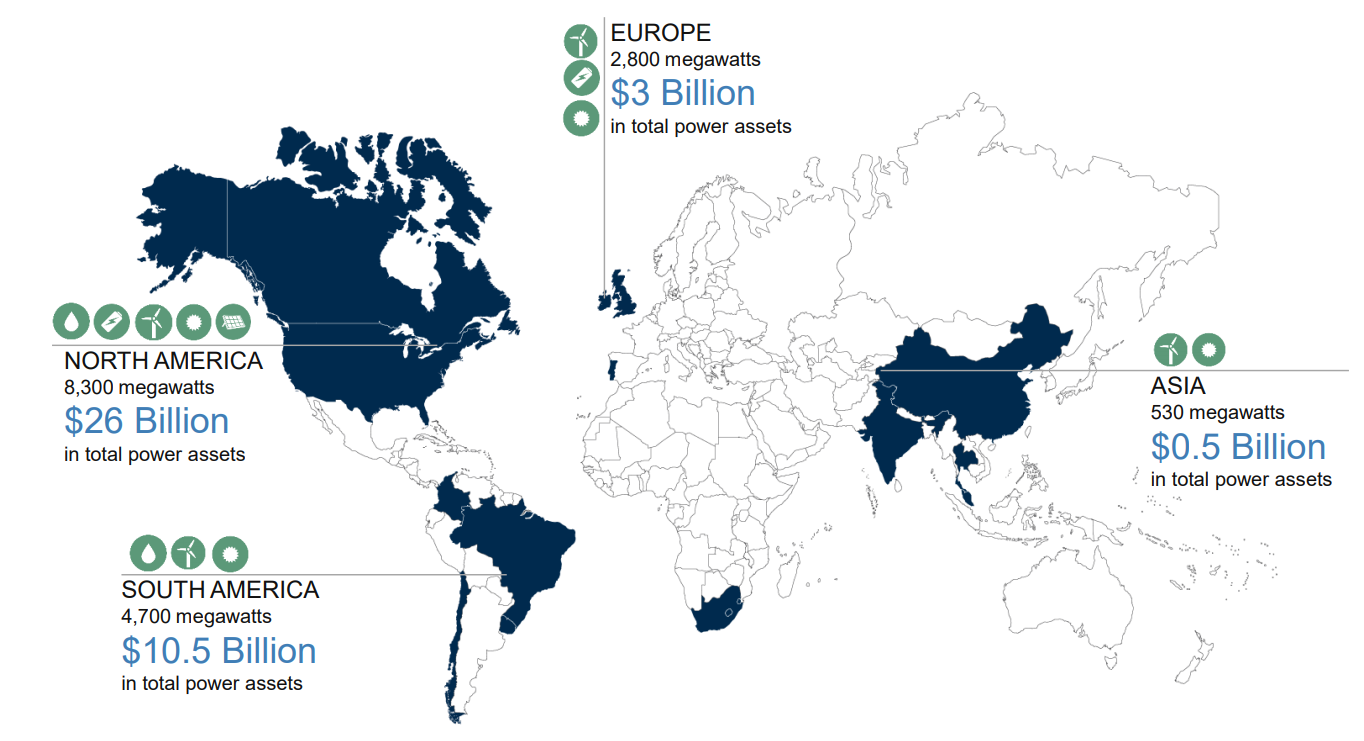
BEP is the oldest (IPO in 2008) and largest yieldCo, with $40 billion in assets made up of 843 renewable energy assets. It owns 16.3 GW of electrical capacity in 24 markets across 14 countries on five continents.
(Source: BEP investor presentation)
82% of its capacity is currently in the form of hydroelectric dams located on 81 rivers around the world.
(Source: BEP investor presentation)
Most of the LP’s assets are located in North America, though BEP has been aggressively expanding into South American hydro power and, more recently, into European and Asian solar and wind assets. In fact, today the company owns 127 solar and wind projects with a total capacity of 4.7 GW. It’s also diversifying into distributed generation and energy storage (for solar and wind).
| Metric | Q1 2018 Results |
| Revenue Growth | 17% |
| Funds From Operation Growth | 16% |
| FFO/Unit Growth | 13% |
| YOY Distribution Growth | 5% |
(Sources: Earnings release, GuruFocus)
Thanks to $625 million in acquisitions in 2017, BEP’s top and bottom line are growing at double digits. Specifically, in March of 2017, a BAM-led consortium (that included BEP) took a controlling 51% interest in TerraForm Power (NASDAQ:TERP). That yieldCo had been bankrupted by poor management by its former sponsor, SunEdison (OTCPK:SUNEQ). Brookfield also acquired 100% of TerraForm Global. In effect, it became the new sponsor for TERP.
The most important metric to focus on is FFO/unit, which is what pays for the distribution. BEP has been growing its payout slower than FFO/unit in order to bring down its FFO payout ratio from the current 79% to management’s long-term goal of 70%. That would allow the company to retain 30% of cash flow to invest in future growth. And that growth potential is the main reason I’m such a fan of this stock.
World-Class Management Team Has A Very Long Growth Runway To Work With
There are two ways a yieldCo can grow: by organically expanding its assets (building on what it owns), or through acquisitions.
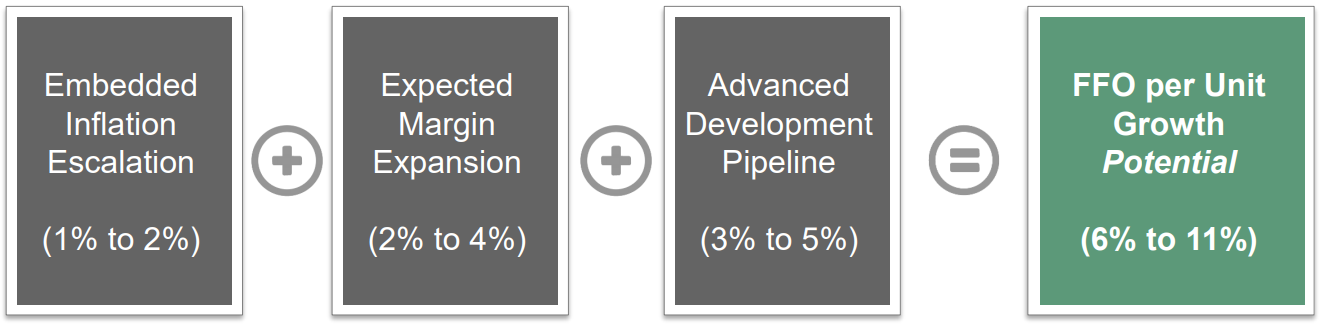
BEP’s Long-Term Organic Growth Guidance
(Source: BEP investor presentation)
BEP’s long-term guidance of 5-9% long-term payout growth (and 12-15% total returns) is predicated purely on the LP’s organic growth potential. Since its IPO in 2008, the company has delivered about 16% annualized total returns (management is great at hitting its guidance targets). BEP plans to continue expanding its organic asset base (what it owns and builds on its own) and cutting costs (economies of scale), which should fuel sufficient FFO/unit growth to hit those long-term payout and total return targets.
(Source: BEP investor presentation)
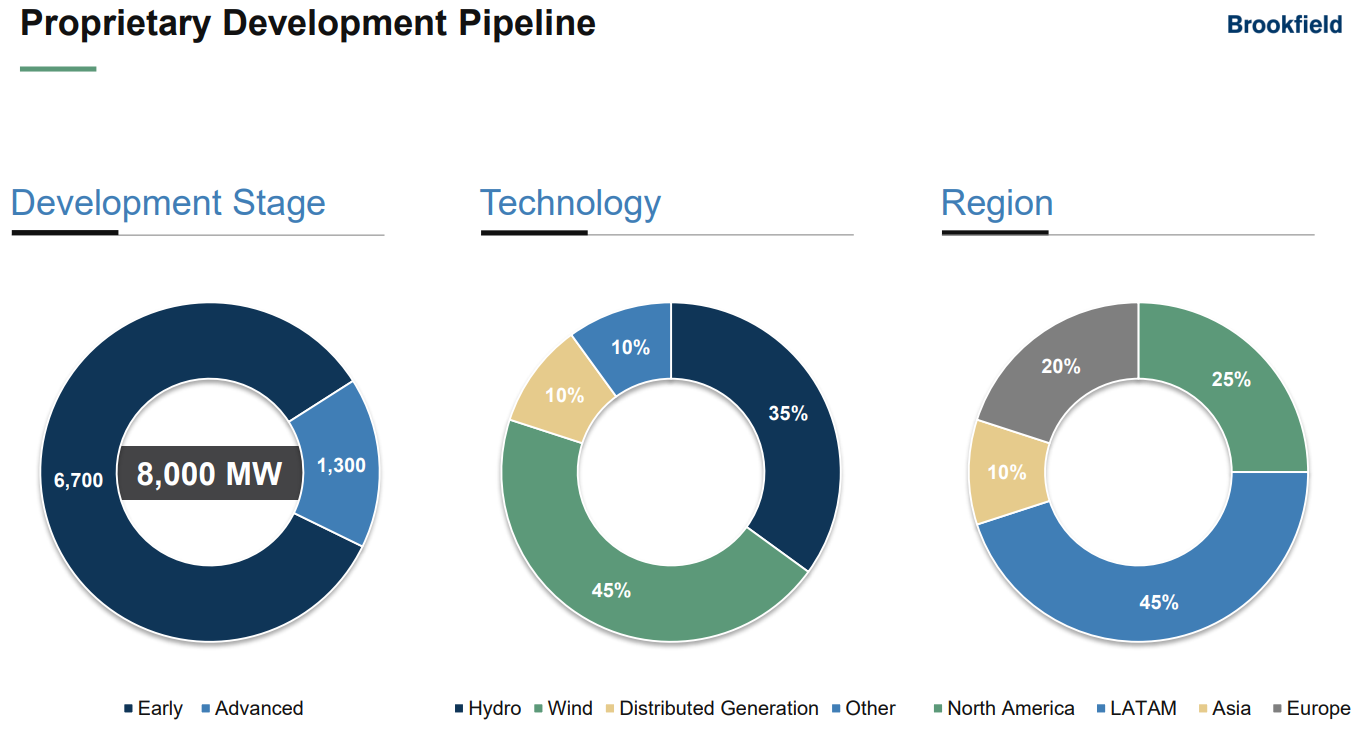
Today, the LP’s total development pipeline stands at 8 GW, including projects which have yet to obtain contracts (shadow backlog) but management expects to eventually complete. That means BEP’s organic growth potential includes expanding its current capacity by 50% in the coming years.
However, it also has a good track record of growing strongly through acquisitions. In fact, that’s been the major growth avenue management has pursued over the past decade. Most of those acquisitions have been for hydro power, but today Brookfield is getting more aggressive in diversifying into wind and solar.
For example, the company recently invested an additional $650 million into TerraForm to allow it to acquire European yieldCo Saeta Yield. As a result, Brookfield boosted its ownership of TERP ($581 million in 2017 FFO), from 51% to 65%. BEP’s share of the $650 million investment was $420 million, and today BEP owns 30% of TERP (and provides its management).
(Source: TerraForm Global)
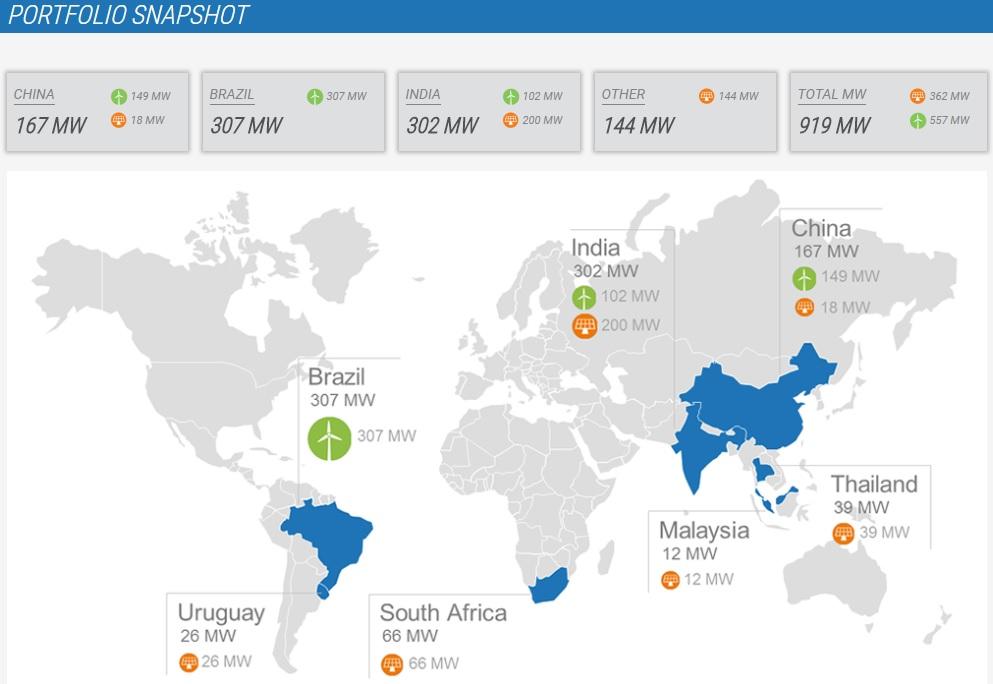
Note that this 8 GW growth backlog doesn’t include the nearly 1 GW of solar and winds projects located in 13 countries that Brookfield bought when it acquired TerraForm Global for $1.34 billion. BEP (or TERP) is expected to eventually buy these assets. If BEP acquires them outright, then it would boost its FFO by about 10%. If TERP acquires them (unlikely given it’s busy with its own project backlog), then BEP would still benefit from its 30% stake in TERP.
Today, BEP has total available liquidity (cash plus remaining borrowing power under revolving credit facilities) of $1.7 billion. That’s going to be used to fund its impressive growth backlog. And when management finds profitable opportunities for acquisitions (such as distressed yieldCos with great assets), it can easily tap capital markets to buy them at fire sale prices.
(Source: BEP investor presentation)
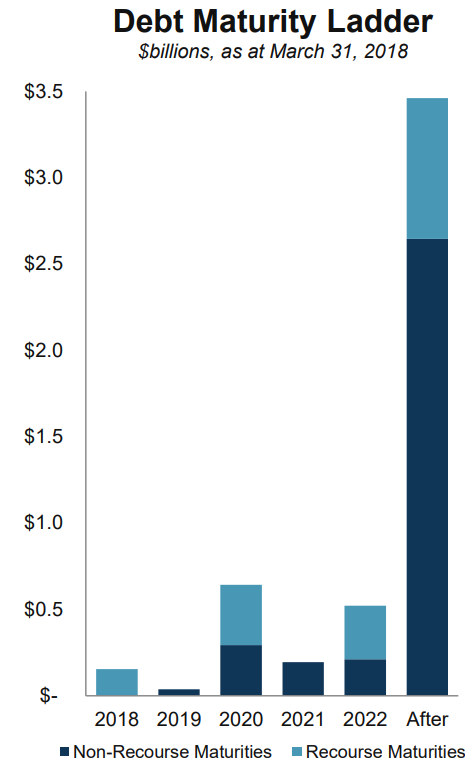
The key to BEP’s growth is its strong access to accretive capital. The LP’s debt is 87% fixed-rate, and 70% is non-recourse project-level debt. This means that each project is financed by its own loan (average duration 10.3 years, with a 5.8% interest rate). This is so should anything go wrong (worst-case scenario) and a project can’t cover its interest payments with cash flow, then creditors can foreclose on the renewable energy asset themselves. They can’t go after BEP’s other cash flow. In other words, by using non-recourse debt, BEP helps create a strong safety buffer for its distribution.
The bottom line is that Brookfield Renewable enjoys numerous competitive advantages that make it a great low-risk, high-yield income growth stock. Those include extremely experienced and proven management, strong access to low-cost growth capital, and a very long growth runway created by the world’s ongoing switch to green energy.
NextEra Energy Partners: America’s Fastest-Growing YieldCo
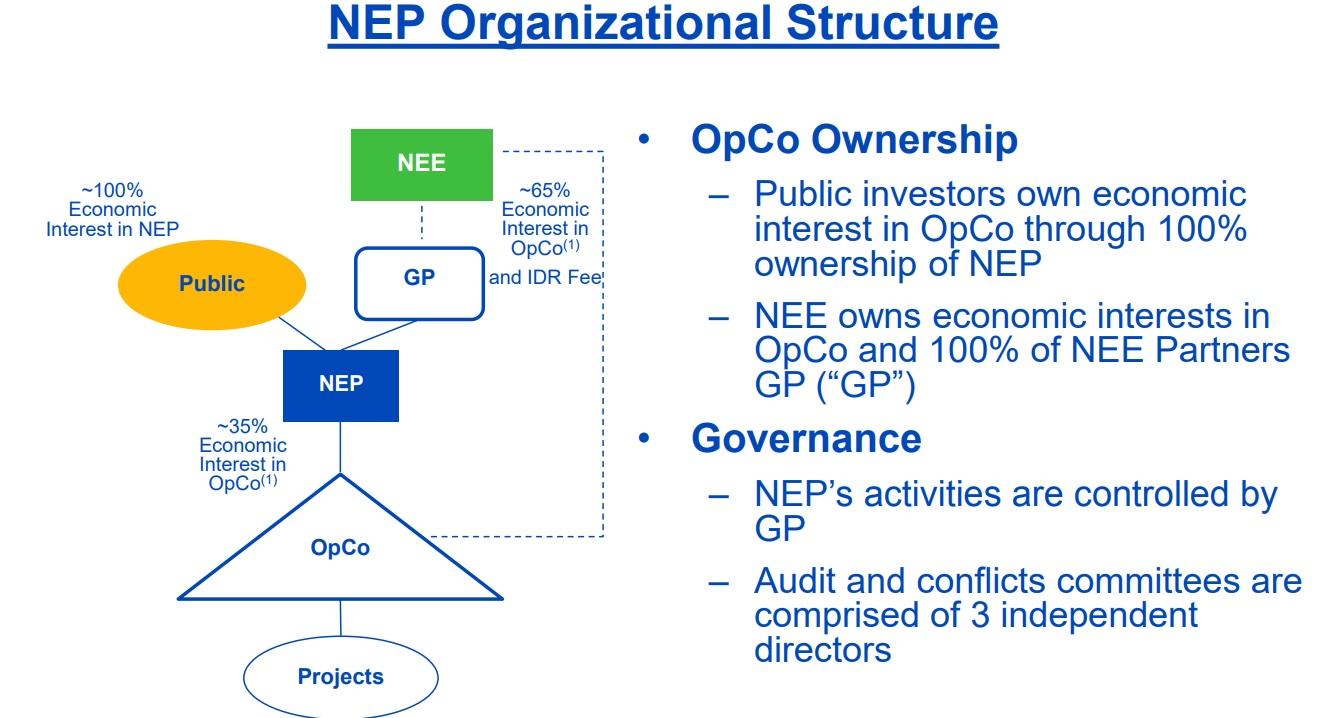
NextEra Energy Partners IPO’d four years ago under the sponsorship of NextEra Energy (NYSE:NEE). NEE is the largest renewable energy provider in America and owns 65% of the yieldCo’s limited units, as well as its IDRs. And just like with BEP, those IDRs are capped at 25% to lower its cost of capital and allow NEP to grow faster and more profitably.
(Source: NextEra Energy investor presentation)
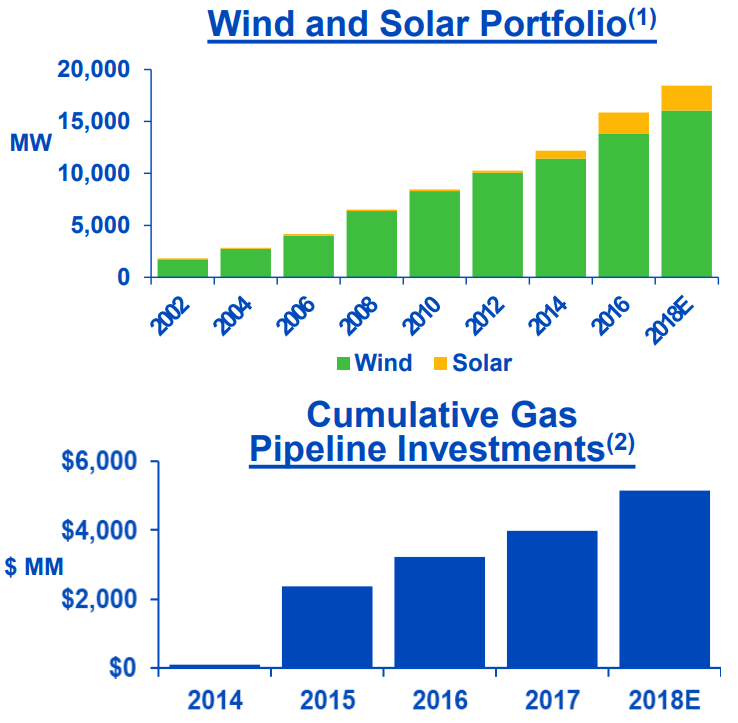
Basically, NextEra Energy Partners’ job is to allow NEE to monetize the large number of renewable energy and pipeline assets it’s been diversifying into over the years (part of its NextEra Energy Resources subsidiary).
NextEra Energy Resources Asset Growth Over Time
(Source: NextEra Energy investor presentation)
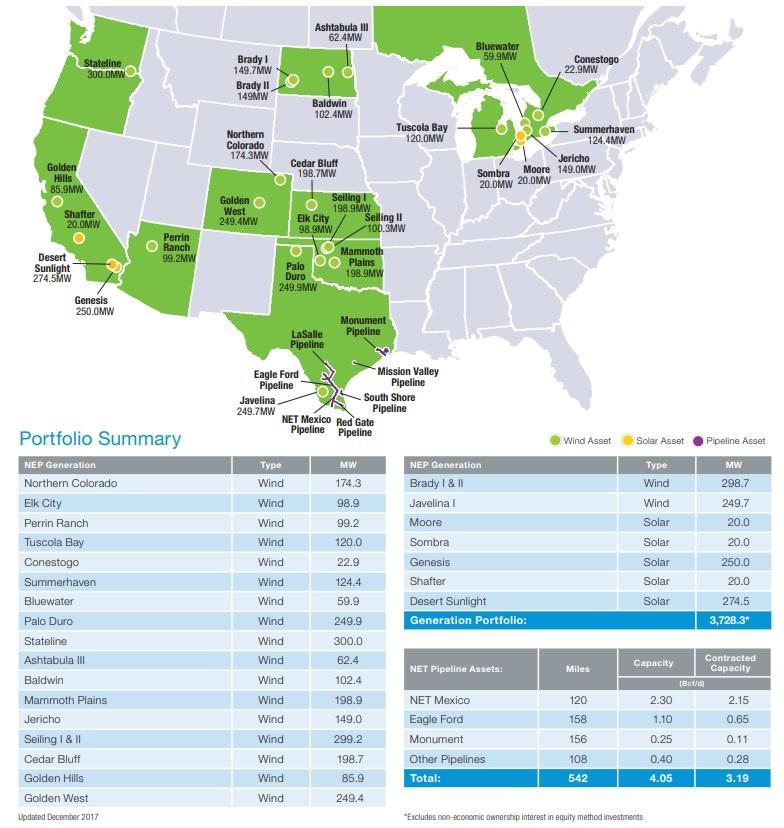
As with BEP, NEP raises external debt and equity capital from investors to acquire these projects. Over the last four years, the yieldCo’s asset base has grown to include 3.7 GW of solar and wind projects and 542 miles of natural gas pipelines in Texas. These assets make up 74% and 26% of NEP’s revenue, respectively.
(Source: NextEra Investor Presentation)
Just like BEP, NEP’s generous and fast-growing distribution is supported by very stable cash flow available for distribution or CAFD. Its average remaining PPA contract is for 18 years, and its average counter-party’s credit rating is A3 from Moody’s (A- equivalent for S&P). An important difference between NEP and BEP, however, is that it issues a 1099 rather than a K-1 (most yieldCos do). However, due to tax equity accounting, it isn’t expected to pay any corporate taxes for at least 15 years.
And just as with BEP, NEP uses a large amount of self-amortizing, non-recourse project-level debt (90% of the debt on its balance sheet). That means its loans are self-funding, with cash flow from individual projects servicing both interest payments and paying off principal over the long duration of its PPA contracts. This also insulated NEP’s overall cash flow from its creditors and reduces its distribution risk.
(Source: NextEra Energy investor presentation)
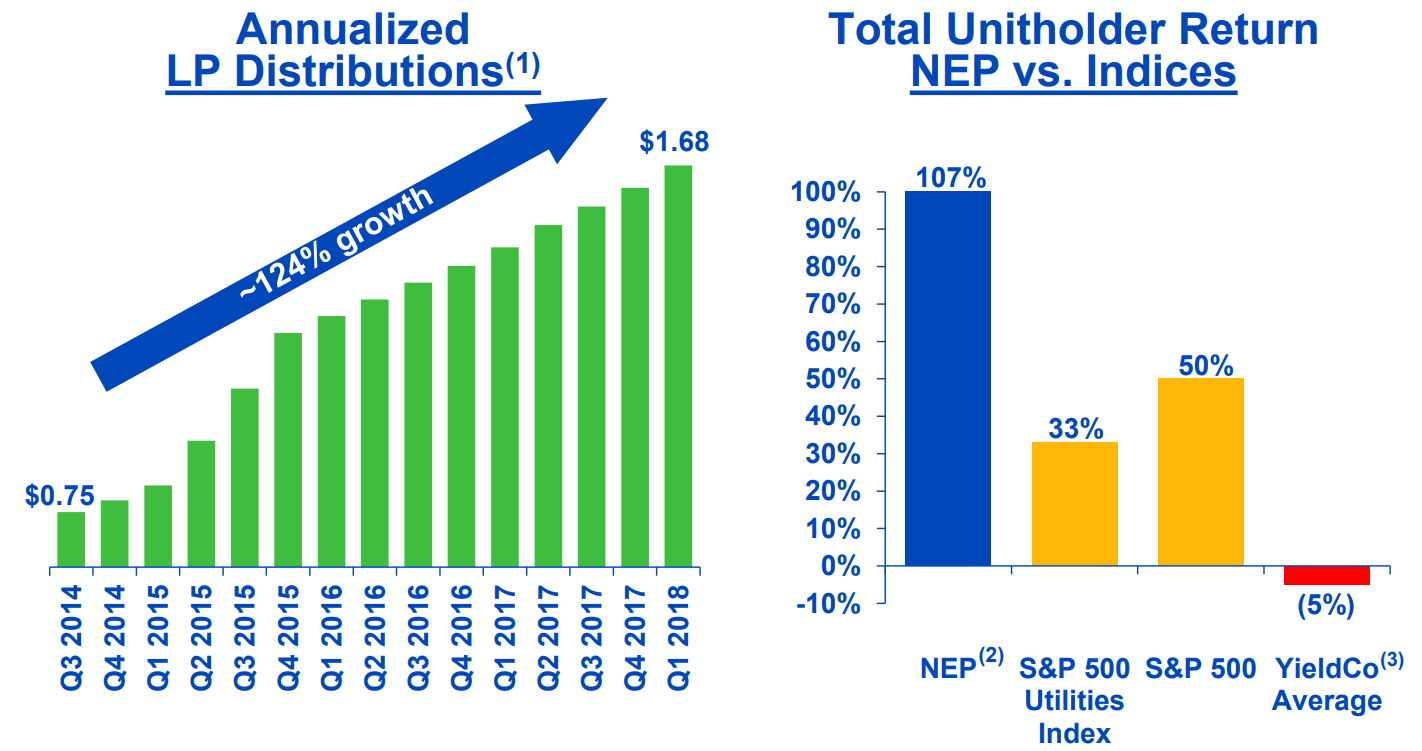
NEE’s rapid dropdowns to NEP has allowed it to grow its distribution by 22% CAGR since its IPO. That has resulted in significant outperformance of not just other yieldCos but most utilities and the S&P 500 itself.
And over the past year, NEP’s growth has continued at a torrid pace.
| Metric | Q1 2018 Results |
| Adjusted EBITDA | 52% |
| Cash Available For Distribution (Post Debt Repayment) | 138% |
| CAFD/Unit | 74% |
| YOY Distribution Growth | 15% |
(Sources: Earnings release, GuruFocus)
That’s thanks to ongoing dropdowns that have resulted in net CAFD to investors to more than double. This not just allowed the company to increase its payout at 15% (the fastest growth rate in the industry) but also to lower its CAFD payout ratio to just 33%.
However, NEP’s management (provided by NEE) isn’t just about growth through acquisitions. It’s also highly skilled at capital recycling, meaning selling assets at a profit to fund even higher-yielding ones. For example, recently NEP announced it was selling 396 MW of Canadian solar and wind projects for $582 million and $689 million in debt assumption. That will not just reduce the yieldCo’s debt by 19%, but management plans to deploy the cash into more profitable US-based projects. Ones that are expected to generate far more than the $38 million in average annual CAFD those assets were bringing in.
That’s because NEP is selling those Canadian assets at a CAFD yield of just 6.6%. That’s compared to recent industry transactions that had cash yields of 7-9%. NEP’s usual dropdown has a cash yield of 8-10%, meaning that this money is likely to result in a significant boost to CAFD/unit.
Better yet? Because of beneficial US tax incentives, management believes it will be able to extend the company’s tax shield even further, meaning that NEP won’t have to pay corporate taxes for at least 16 years.
Basically, NextEra Energy Partners is America’s fastest-growing yieldCo. And that fast growth rate is likely to extend for at least the next decade, but probably longer.
Long-Term Growth Potential Is Enormous
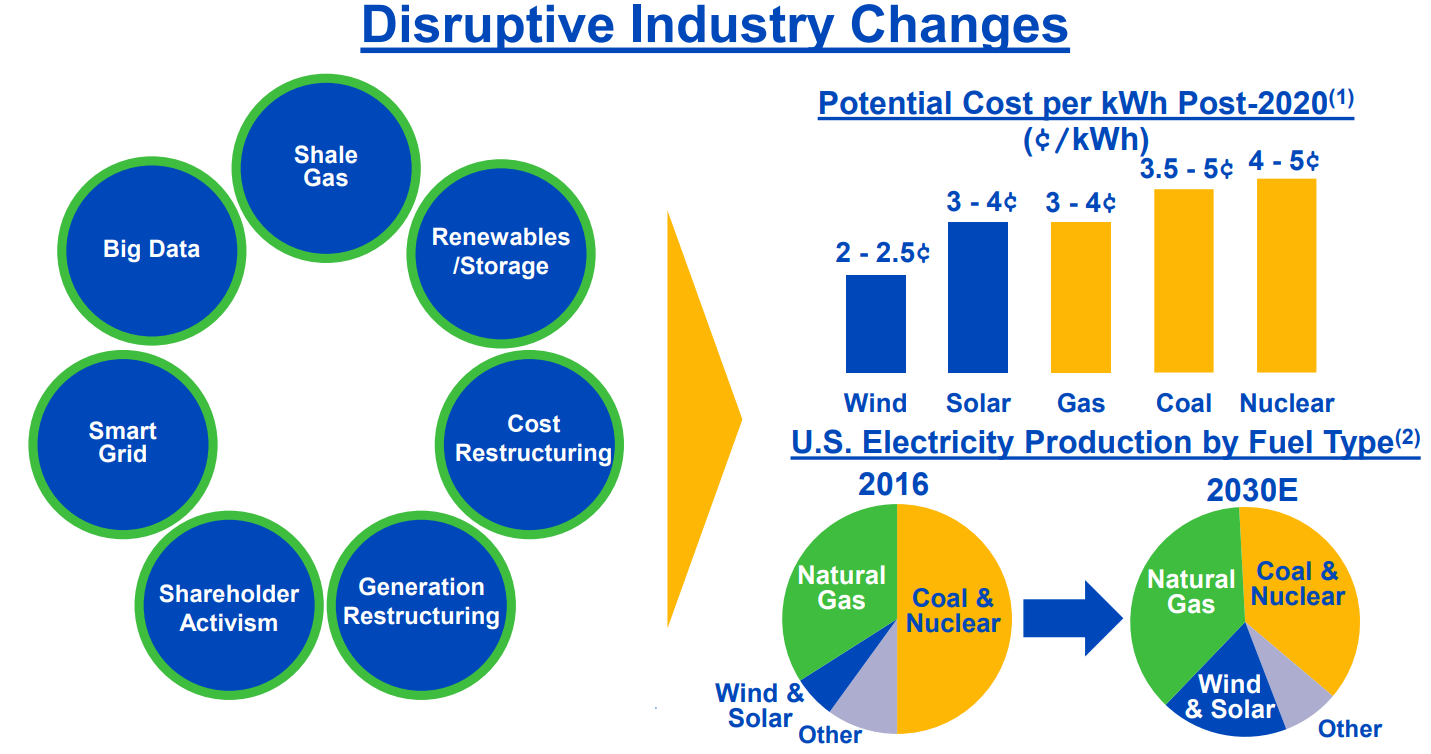
The core of NEP’s investment thesis is the incredible growth opportunity represented by the rapid adoption of solar and wind power in the US.
(Source: NextEra Energy investor presentation)
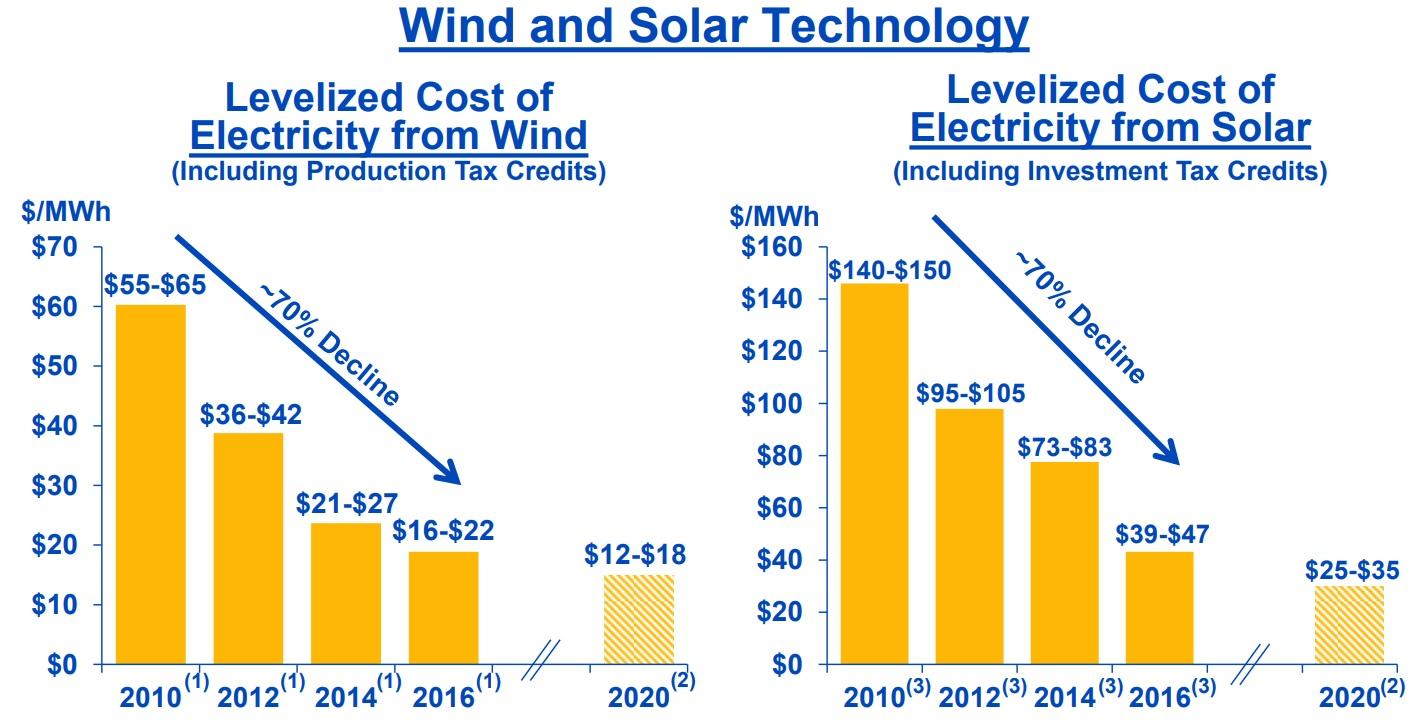
That’s largely due to a rapid decrease in costs as technology and economies of scale have improved to make solar and wind as cheap or cheaper on a levelized basis than coal, gas, or nuclear.
(Source: NextEra Energy investor presentation)
Note that factoring in storage costs and a lower capacity factor (average output over potential capacity), solar and wind are not yet competitive with gas as a base load source of power. However, costs are expected to continue falling over time.
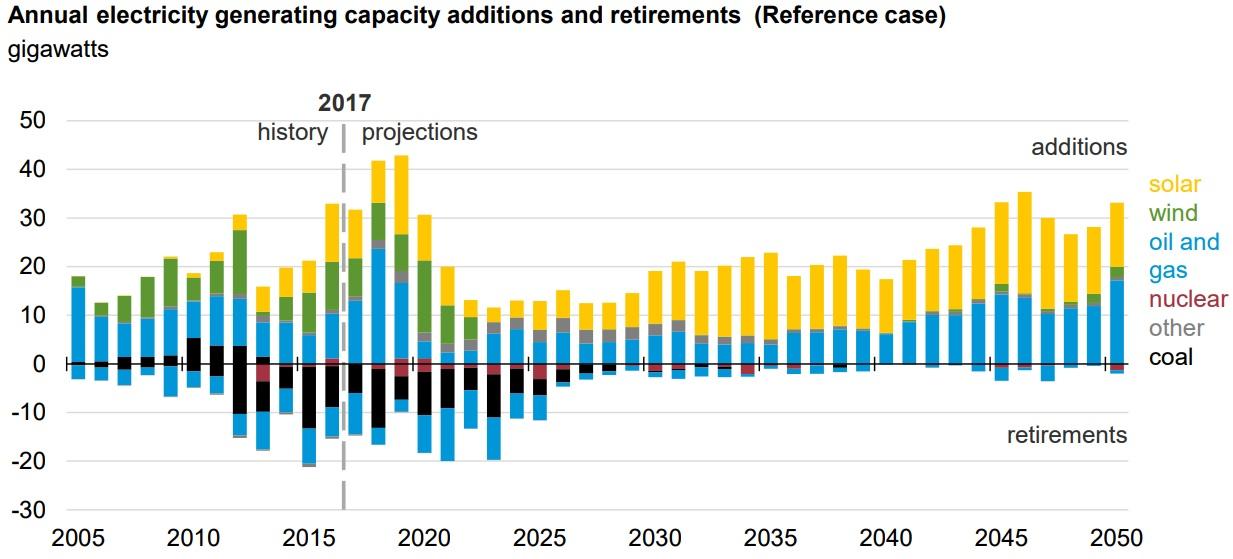
That’s why the future of American energy production is going to be dominated by both gas and renewable power.
(Source: US Energy Information Administration)
And according to the US Energy Information Administration, through 2050 solar will be the fastest-growing source of US power.
(Source: NextEra Energy Investor Presentation)
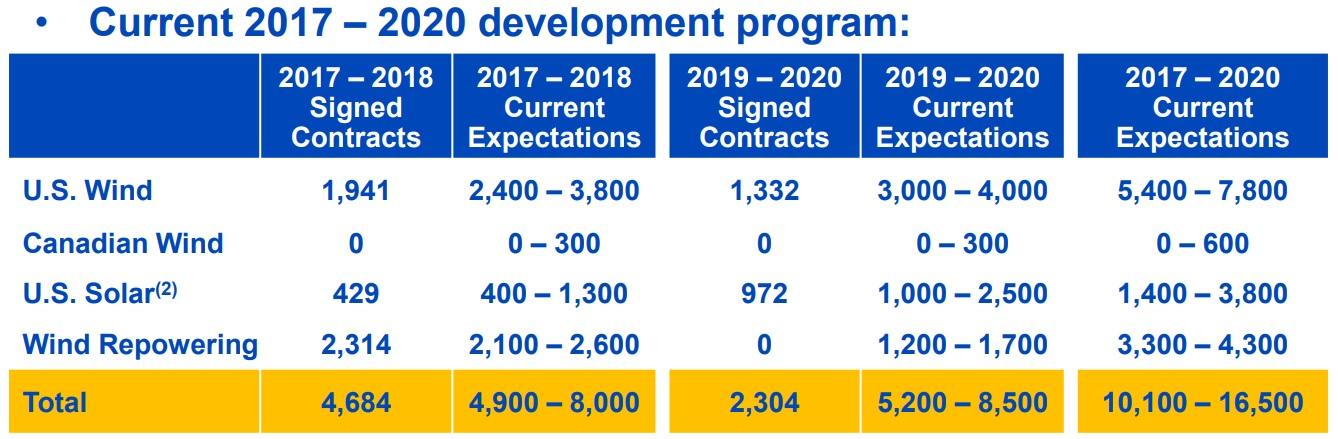
This is why NEE is investing 55% of its $42 billion growth budget between 2017 and 2020 into building up to 16 GW of renewable projects. For context, NEE’s total renewable capacity is now about 20 GW, meaning the company plans to grow its renewable capacity by 50-75% by 2020. But that’s just the start of NextEra’s ambitious growth plans.
(Source: NextEra Energy Investor Presentation)
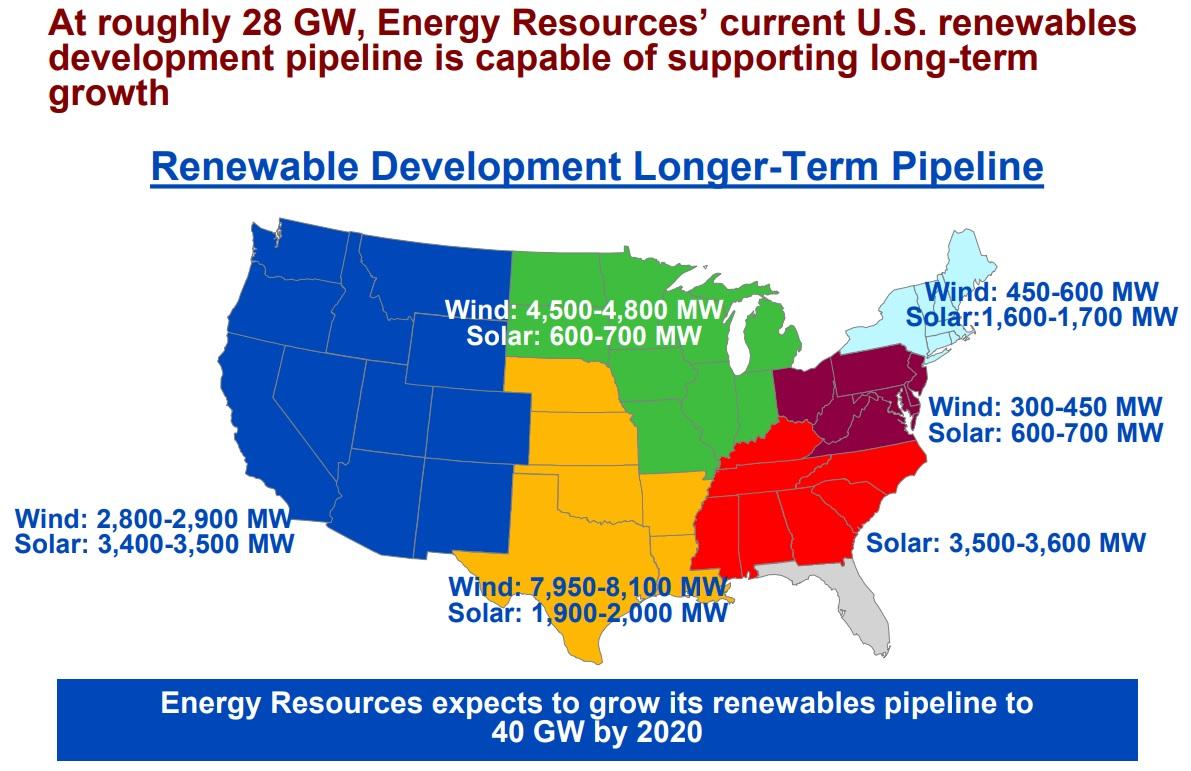
That’s because NEE’s current solar and wind backlog is about half the 28 GW of renewable projects it plans to eventually build (shadow backlog for which contracts haven’t been secured yet). And by 2020, management thinks that it will increase the current and potential renewable backlog to 40 GW. For context, at the end of 2017, the entire installed US wind and solar generating capacity was 121 GW. This means that over the next few years, NextEra Energy plans to increase US renewable capacity by 44% all on its own.
And as its renewable energy yieldCo, NEP is going to be the chief method of monetizing those assets. Or, to put it another way, market conditions permitting, NEP could be looking at a potential dropdown runway of 49 GW of new solar and wind projects. That would represent a 13-fold increase in its current renewable energy capacity and gives it by far the best long-term growth runway in the industry.
(Source: NextEra Energy investor presentation)
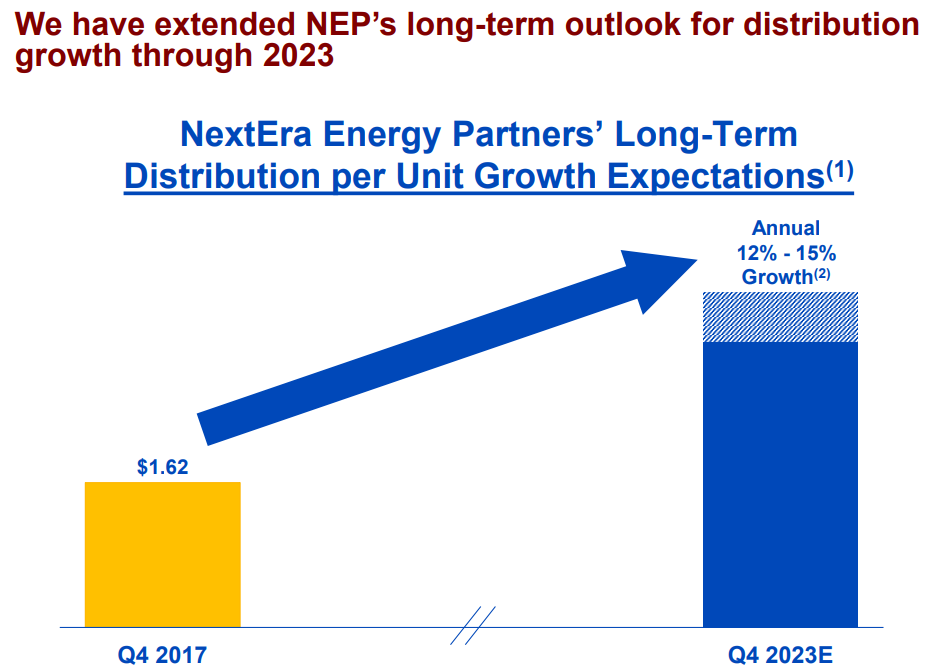
Which is why management once more pushed back the time horizon for NEP’s projected 12-15% payout growth rate to the end of 2023.
The bottom line is that NEP is the industry’s growth darling, while BEP is the industry blue chip. And both high-yield income growth stocks are likely to generate not just generous, safe, and fast-growing income, but market smashing returns as well.
Payout Profiles: Generous, Low-Risk, And Fast Income Growth With Market-Beating Return Potential
| YieldCo | Yield | Payout Ratio | Projected 10-Year Distribution Growth |
10-Year Potential Annual Total Returns |
| Brookfield Renewable Partners | 6.4% | 79% | 5% to 9% | 10.4% to 15.4% |
| NextEra Energy Partners | 3.7% | 33% | 12% to 15% | 15.7% to 18.7% |
| S&P 500 | 1.8% | 40% | 6.2% | 4% to 8% |
(Sources: Earnings releases, GuruFocus, F.A.S.T. Graphs, management guidance, Yardeni Research, Multpl.com, Gordon Dividend Growth Model)
The most important aspect of any income investment is the payout profile, which consists of three parts: yield, payout safety, and long-term growth potential.
Both Brookfield Renewable Partners and NextEra Energy Partners are offering very generous yields relative to the broader market (two to four times as high). More importantly, those distributions are highly secure, owing to modest-to-low cash flow payout ratios. Given this, along with the highly stable and growing nature of that cash flow, investors have little reason to worry about a potential payout cut.
Of course, there’s more to a low-risk distribution than just a good payout ratio. The balance sheet is also very important. That’s especially true in a growth-oriented and highly capital-intensive industry such as this.
| YieldCo | Debt/Adjusted EBITDA | Interest Coverage Ratio | Debt/Capital | S&P Credit Rating |
Average Interest Cost |
| Brookfield Renewable Partners | 8.2 | 3.0 | 38% | BBB+ | 5.7% |
| NextEra Energy Partners | 3.5 | 4.0 | 64% | BB | 7.2% |
| Industry Average | 4.9 | 3.3 | 61% | NA | NA |
(Sources: Earnings releases, Investor presentations, GuruFocus, F.A.S.T. Graphs, CSI Marketing)
At first glance, it seems odd that BEP would have such a strong credit rating, since its leverage ratio (Debt/Adjusted EBITDA) is so high. However, remember that 70% of that is non-recourse debt (effectively off-balance sheet). At the corporate level (what investors are responsible for), the leverage ratio is just 2.5 and its interest coverage ratio is 7.0. This explains the strong investment grade credit rating (highest in the yieldCo industry) and why BEP can borrow at the corporate level at an average interest rate of 4.5% (its average duration is 6.1 years).
Meanwhile, NEP has below-average leverage for a yieldCo and above-average interest coverage. Yet, it has a junk bond credit rating and much higher average interest costs. The reason for this is due to the specifics of how management finances the company’s projects. NEP typically uses about 4.5 times effective project-level leverage, meaning it borrows $4.5 in non-recourse, self-amortizing debt for each $1 in equity (retained CAFD or new units sold). Because of this higher project-level leverage, credit rating agencies give it a junk bond rating. And since non-recourse loans naturally have higher interest rates (higher risk than recourse loans), this explains NEP’s higher borrowing costs. The good news is that NEP’s CAFD is calculated after deducting the interest costs on its debt, and means that investors can remain confident in the yieldCo’s low payout ratio and strong distribution security.
In addition, NEP has no issue growing profitably, since its large amount of retained cash flow allows the company to use relatively low amounts of equity issuances. In fact, management doesn’t plan to sell new units to finance growth other than via its DRIP plan. This means that NEP’s weighted average cost of capital is about 4.7%, about half the cash yield on the projects it’s buying from NEE.
Finally, we come to payout growth potential. For both stocks, this is a crucial part of the investment thesis, since without strong growth, neither one can likely achieve double-digit total returns. Fortunately, the strong growth runways for both yieldCos is why analysts not just think that management distribution growth guidance is reasonable, but slightly conservative.
For example, the 10-year analyst consensus is for BEP and NEP to grow their payouts at 9% and 15%, respectively. That’s at the upper range of guidance and over a time frame that spans through 2028. While all such long-term forecasts must be taken with a grain of salt, I consider them reasonable given each stock’s enormous growth potential.
This means that both BEP and NEP are not just a source of generous and low-risk distributions, but also likely to generate far superior returns to the 4-8% the S&P 500 is likely to provide over the next decade off current valuations.
Valuation: Both Attractively Priced, But NextEra Is The Stronger Buy Now
 BEP Total Return Price data by YCharts
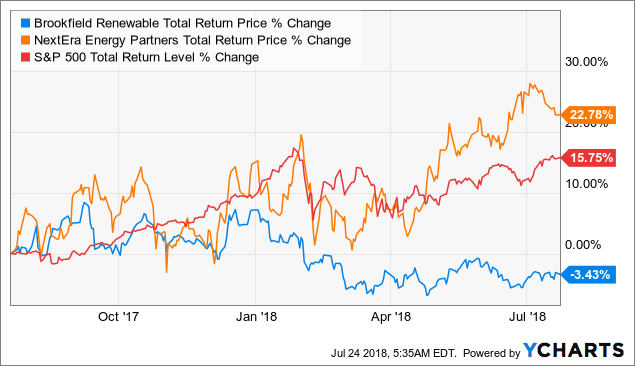
Given NEP’s far superior performance over the past year and BEP’s large underperformance, one might assume that BEP would be the more undervalued stock. However, looks can be deceiving.
That’s because there are numerous ways to value a stock (dozens of models in fact). None are 100% objectively correct, which is why I use a combination of them to create a more robust valuation model that minimizes the risks of overpaying.
The first is the total return potential from the payout profile. This is based on the Gordon Dividend Growth model, which has been highly accurate since the 1950s. In fact, BAM uses this model for all its long-term total return projections for its LPs.
This model assumes several things, including an initial price that starts at fair value and that payouts are in line with cash flow (stable payout ratio). It also assumes that valuation multiples are mean-reverting and thus cancel out over time. Therefore, if a dividend stock starts at fair value, then over the long term its total return will approximate yield + payout growth.
My goal is to only recommend income growth stocks that have a good chance of beating the market. And to own them personally, I require a 10+% total return potential. On both counts, BEP and NEP pass this first value screen, though NEP appears the better investment thanks to its faster payout growth rate and superior total return potential.
But what if that key assumption in the Gordon Dividend Growth model (starting at fair value) is incorrect? If you buy a dividend stock at beneath fair value, then mean reversion over time will actually result in multiple expansion that will boost your total return. To determine how likely multiple expansion is, I use the yieldCo equivalent of a P/E ratio. That’s because Benjamin Graham, Buffett’s mentor and the father of modern value investing, devised a formula to estimate what 10-year EPS growth rate was baked into a stock’s price. If a yieldCo can grow faster than this implied growth rate, then it’s likely to see its multiple expand and enjoy even stronger returns than the Gordon Dividend Growth Model projects.
| YieldCo | Forward P/Cash Flow | Implied 10-Year Growth Rate | Yield | Historical Median Yield |
| Brookfield Renewable Partners | 12.3 | 2% | 6.4% | 5.7% |
| NextEra Energy Partners | 6.5 | -1% | 3.7% | 3.6% |
(Sources: Earnings releases, GuruFocus, Benjamin Graham)
Currently, BEP and NEP are trading at 12.3 and 6.5 times forward cash flow. The reason that NEP’s is so much lower is that it’s been growing much faster via dropdowns and funding that with relatively little equity (which would boost its market cap and raise its price/cash flow). The recent Canadian asset sale will likely allow the yieldCo to avoid investor dilution even further and keep this figure very low.
But in either case, both yieldCos’ current valuation metrics imply a very low long-term growth rate – one that both will easily be able to exceed many times over given their current growth plans and ample access to low-cost growth capital. This means that both yieldCos are likely to face significant multiple expansion over the next 10 years and generate even better total returns.
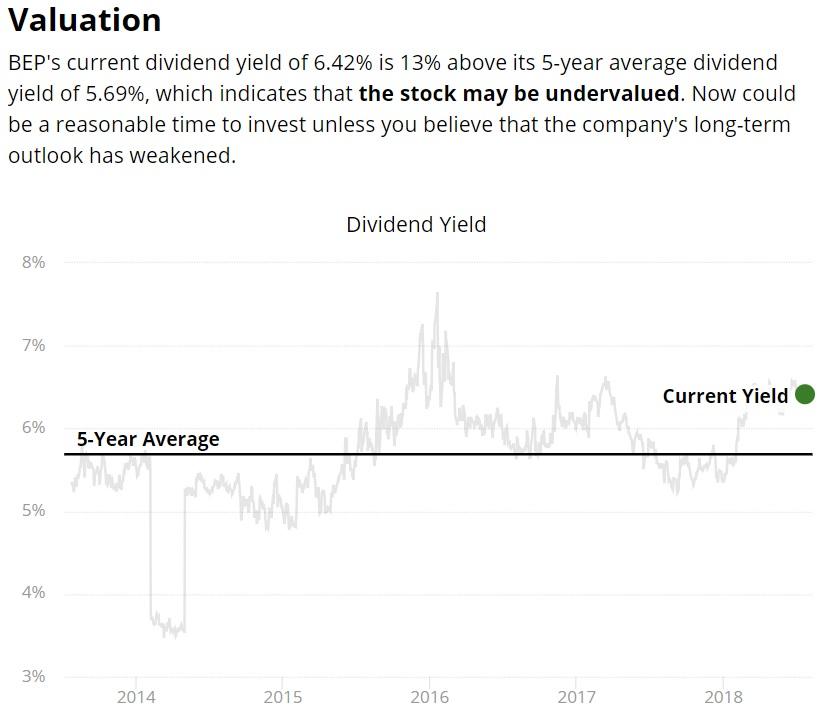
Finally, I like to compare the yield to its historical norm. That’s for two reasons. First, as a high-yield income investor, the yield is the most relevant valuation metric to my overall strategy. Second, yields on highly stable business models (like this one) tend to be mean-reverting over time and cycle around a relatively fixed point that approximates fair value.
I usually look at both the five-year average yield and 13-year median yield. That’s to ensure that some industry-wide event (like a yieldCo bear market) doesn’t skew the data and give a false reading. In the case of NEP, which is just four years old, there is no five-year average. Thus, we need to use the four-year median, which is the most accurate representation of its yield over time. BEP is 10 years old, so I look at its 10-year median yield and five-year average yield.
(Sources: Simply Safe Dividends)
BEP’s yield is currently 13% above its five-year average and 12% above its 10-year median. That implies it is roughly 12.5% undervalued. Meanwhile, NEP’s yield is about 3% above its four-year median, implying it might be close to fair value.
Taking into account all of these different valuation models, I estimate that the overall valuation picture for these yieldCos looks like this:
| YieldCo | Estimated Fair Value | Discount To Fair Value |
| Brookfield Renewable Energy Partners | $35 | 13% |
| NextEra Energy Partners | $61 | 26% |
(Sources: Earnings releases, Management guidance, F.A.S.T. Graphs, GuruFocus, Simply Safe Dividends, Benjamin Graham)
As you can see, while BEP is nicely undervalued, it’s not a screaming buy (which I define as 25+% undervalued). However, NEP, despite soaring 22% over the past 12 months, is actually twice as undervalued. That’s mostly due to its much lower cash flow multiple and a payout growth potential twice as high as BEP’s.
Ultimately, this means that I can wholeheartedly recommend both high-yield income growth stocks today, with NEP being a “Strong Buy”. Of course, that’s only for investors comfortable with these yieldCos’ risk profiles.
Risks To Consider
First, we need to address one of the biggest potential downsides to owning BEP. That would be its complicated tax structure.
Because of the way it structured, BEP does issue a K-1, and its distributions are considered returns of capital, or ROC. Normally, this would decrease your cost basis, and that’s the case with this company too. However, because it’s an LP that owns other LPs, there is also an income tax provision that applies to how investors adjust their cost basis. For example, say that BEP pays you $1000 in distributions but passes on $500 in net income from its LPs. In that case, you would owe income taxes on the $500 portion, which for most investors means a 25% tax rate (or $125 in taxes). This means that your cost basis would not be adjusted down $1,000 as with most other LPs (or MLPs), but $875.
The good news is that thanks to tax reform, you can deduct up to 20% of BEP’s (and NEP’s) distributions, even if you don’t itemize taxes, through 2025. That will lower your proportional income tax burden (the LP pass-through portion) by that amount. Another good thing is that because BEP is safe to own in retirement accounts, you can avoid this tax headache by owning it in those kinds of accounts. However, when you eventually withdraw money from an IRA or 401(k) (Roth IRA is permanently exempted), you will have to pay marginal tax rates on those funds.
As for the risks to BEP itself, there are several to keep in mind. First, the LP’s global diversification is a double-edged sword. While providing cash flow diversification and incredible long-term growth opportunities (especially in emerging markets), it also creates currency risk.
Specifically, when the US dollar appreciates against local currencies such as the Brazilian real, BEP’s FFO can translate into fewer USDs. Right now, the US dollar is appreciating against most emerging market currencies due to rising US interest rates.
Another risk to consider is execution risk and regulatory/political risk. Brookfield has the most experience of any asset manager in dealing with emerging market political volatility. That’s because it usually invests during an economic downturn, when asset prices are low and FFO yields on invested capital are very high (it usually targets 15%). However, the downside is that emerging markets, especially in Latin America, have been known to occasionally install populist governments, which could theoretically nationalize foreign assets. This is one of the big reasons BEP uses non-recourse project-level debt (the worst-case scenario I mentioned earlier).
Finally, the last BEP-specific risk to keep in mind is that because it’s the oldest yieldCo in America, it also has the least contract protection. While 92% of its FFO is under contract in 2018, that will fall to 65% by 2022. The good news is that these contracts are usually easy to renew. The bad news is that management’s guidance is built around certain power price projections that might prove too optimistic. That’s because as more renewable energy capacity is built around the world, the effective price of green power is likely to fall over time.
This is a risk that all yieldCos face, including NEP. While its average PPA contract is for 18 years, eventually its contracts will expire. And if analyst forecasts of steadily falling wind and solar power costs are correct, that means all yieldCos eventually face a contract cliff in which their CAFD might fall significantly as contracts get renewed at much lower rates.
Another risk to all yieldCos is rising interest rates. Because its standard industry policy to finance most projects with large amounts of non-recourse debt, those loans carry higher interest rates. That’s to compensate the bondholders for their greater risk (lower rank in the cap structure).
For now, both BEP and NEP have no issues financing accretive growth. However, if US (or global in the case of BEP) interest rates rise too high, then the profitability on new projects might fall and reduce the cash flow/unit growth rates of both yieldCos. That, in turn, might make it harder to achieve their stated payout growth and total return targets.
NEP’s interest rate risk is higher than that of BEP due to management’s policy of maintaining between 4.0 and 5.0 project-level debt (higher than BEP’s). While this is a safe amount of debt due to the low risk of a project failing to generate sufficient cash flow (wind and solar variability isn’t that high), it also means that management expects NEP’s credit rating to remain sub-investment grade. That means naturally higher interest rates, which could make the yieldCo more reliant on a strong unit price to finance future growth than BEP.
Bottom Line: These 2 Fast-Growing, High-Yield Stocks Are Potentially Poised For Decades Of Strong Growth
Whether your goal is recession-resistant, high-yield, fast income growth, or market-beating return potential, both Brookfield Renewable Partners and NextEra Energy Partners are two excellent long-term investments.
Both have proven management teams, plenty of access to low-cost capital, and very long growth runways. Thus, they should both deliver generous, low-risk, and fast income growth for the foreseeable future.
And while both stocks have their fair share of risks (as all stocks do), at today’s attractive valuations I have no reservations about recommending both for most diversified high-yield income growth portfolios.
Disclosure: I am/we are long NEP.
I wrote this article myself, and it expresses my own opinions. I am not receiving compensation for it (other than from Seeking Alpha). I have no business relationship with any company whose stock is mentioned in this article.
Be the first to comment