One of the biggest hindrances for the stock market in recent months has been the stubborn persistence in bullish sentiment. Prior to the February market decline, investors were overly enthusiastic, which put the market in a vulnerable position. Since then there have been several instances where the bulls have predominated according to various sentiment polls, while the bears have remained scarce. Lately, however, there has been an important shift in this dynamic. While the bull market’s “wall of worry” hasn’t been fully repaired yet, it’s definitely looking better. In today’s report we’ll examine the improvement taking place below the surface and will focus on the area which should benefit once the market’s next advancing phase begins.
For many participants the last three months have been an exhausting experience. The 10% drop in the S&P 500 Index (SPX) in February was followed by a failed rally back to the January high, then another harrowing decline followed by five weeks of sideways movement. After riding this emotional roller coaster it’s not surprising that some traders have become listless and unenthusiastic about the stock market’s interim prospects. More than a few commentators have even admitted to feeling “gloomy” about the stock market.
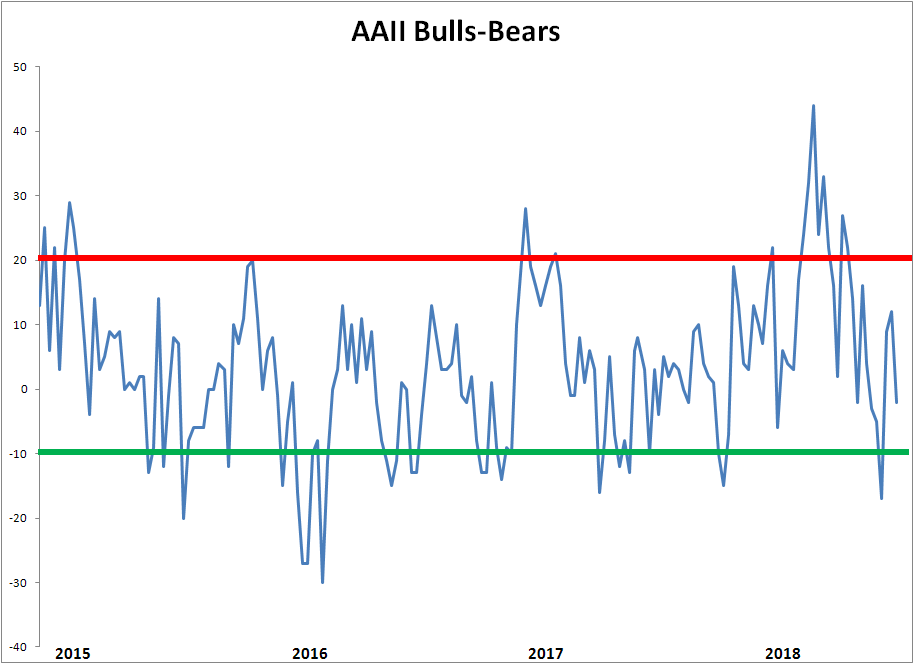
More than anything else, the narrowing range in the SPX combined with low volatility as reflected in the CBOE Volatility Index (VIX) has resulted in a neutral bias in investor sentiment. This can be clearly seen in the latest sentiment poll conducted by the American Association of Individual Investors (AAII). According to AAII, more respondents to last week’s poll identified as being neutral on the stock market’s intermediate outlook than either bullish or bearish. To be exact, 41% said they were “neutral” with 28% bullish and 30% bearish.
Source: AAII
From the standpoint of the contrarian sentiment theory, the latest AAII poll provides an important insight into the emotional bias of the typical retail investor. It suggests that the dangerous excess in investor optimism prior to February’s market decline has been alleviated and the market is therefore in a much better condition. The market’s proverbial “wall of worry” (which every bull market needs to climb) has one less crack in it and is now closer to being fully repaired.
Speaking of repairs, one of the major areas of repair we’ve talked about in recent reports has been market breadth. While the advance-decline (A-D) line for the NYSE has been remarkably buoyant given the market correction of the recent months, the new 52-week highs and lows have been quite soft. In particular, the number of stocks making new 52-week lows has been well above 40 on most days which is an unhealthy sign. NASDAQ stocks haven’t been immune from this problem either, which has been an ongoing concern.
That dynamic may be on the verge of changing for the better, however. In the last couple of trading sessions the new high-new low differential on both exchanges has been positive with stocks making new 52-week highs increasing. The tech sector in particular has shown some major improvement in this area, and on Monday the new 52-week lows for the NASDAQ were below 40 for the first time since April 18. Of equal significance, the new high-low differential for the NASDAQ was a remarkably strong 4:1 in favor of new highs. That’s the kind of showing we need to see more of, and if it continues a few more days we’ll have a strong indication that the correction, for the tech stocks at least, has run its course.
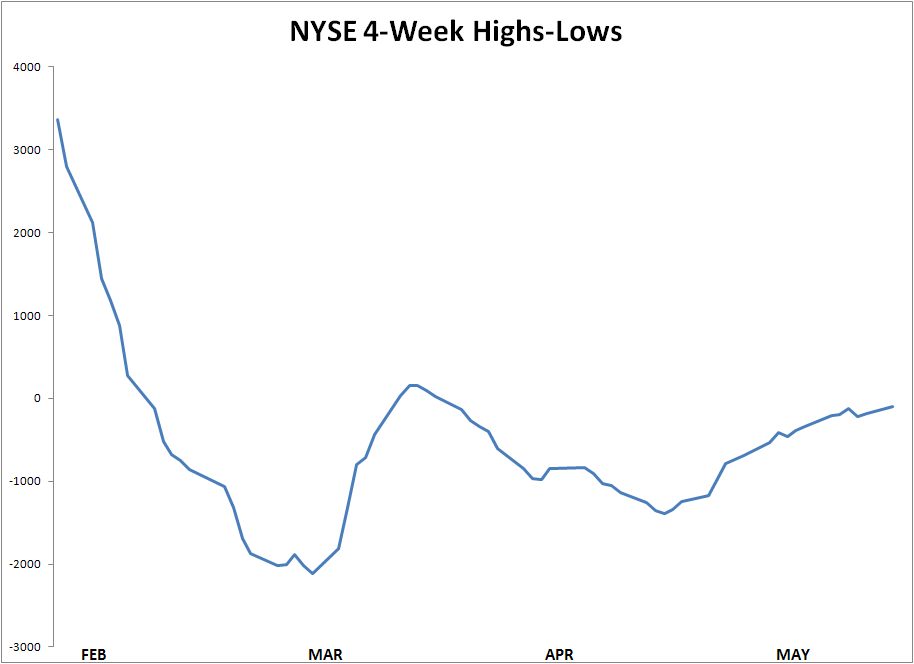
For the NYSE market, the new 52-week lows remain above 40, although there has been some improvement in the new high-low differential. Of importance for the immediate-term (1-4 week) market outlook, the 4-week rate of change in the cumulative new highs-lows is still gradually trending higher. This particular graph is my favorite measure of the internal momentum profile for the NYSE. The new highs and lows reflect the incremental demand for equities, so as long as this indicator is rising the path of least resistance for the broad market is considered to be up on a near term basis.
Source: WSJ
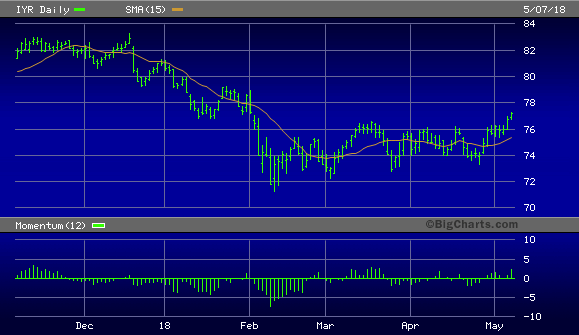
One of the beneficiaries of the stock market’s improving sentiment and internal momentum profile of late has been the real estate stocks. The real estate stocks, which include REITs, home builders, storage companies and lumber producers, are showing signs of improvement after being loss leaders in the last few months. Shown below is the iShares U.S. Real Estate ETF (IYR) which is one of my favorite reflections of this important sector.
Source: BigCharts
In the last few commentaries, I’ve stressed that if IYR breaks decisively above the 77.00 level (which would represent a breakout from its 3-month lateral trading range), we could have a major REIT-led broad market rally on our hands. This outlook is predicated on the NYSE new 52-week lows contracting below 40 for at least a few days, though, so we still need to see improvement in that quarter. As can be seen below, however, IYR has closed above the benchmark 77.00 level as of May 7. This is definitely a step in the right direction for the real estate stocks and can be considered a preliminary sign that this important market segment will perform well in the next phase of the bull market. The improvement seen among the actively traded real estate stocks also implies that investors are gradually coming to terms with higher U.S. Treasury yields, which will be good news indeed when it comes to full fruition.
For now, I recommend investors keep a large portion of their capital in cash and wait for the aforementioned improvement in the NYSE new highs-new lows differential to be made before increasing long commitments among stocks and ETFs. We still need to see the new 52-week lows decline below 40 for a few days to let us know that the broad market correction has finally ended. Some nibbling can be done among the relative strength areas of the market, however, including the real estate stock segment mentioned above.
Disclosure: I am/we are long IYR, FXU.
I wrote this article myself, and it expresses my own opinions. I am not receiving compensation for it (other than from Seeking Alpha). I have no business relationship with any company whose stock is mentioned in this article.
Be the first to comment