Was January the high watermark for 2018?
When the market (and my portfolio) peaked in January, I had a strong sense that for the short term, this may be as good as it gets. In retrospect, this was the perfect time to raise the cash position. That sounds easy, but it’s difficult for me to cut back on the winners.
When the portfolio makes a new high, I note it on my spreadsheet. New highs were a regular occurrence in mid-January. The portfolio’s high watermark for the quarter was January 22, although the broad market peaked on January 26. The portfolio gave up 8.5% in value from January 22 through the end of Q1 on March 29. On January 22, the portfolio cash position was 4.51%, which is relatively high for me.
February saw the return of volatility, breaking a year of relative tranquility. One headline read, “February was an insane month for the stock market,” with the market spiking to a quarter low on February 9. The low point of the quarter for the portfolio was a day earlier, on February 8. It was down 9.3% from the January 22 high.
I expect volatility will be with us for the remainder of 2018. Bullish and bearish cross-currents are not yet resolved, so I’m looking for more daily price swings within a S&P 500 range of 2,581.00 (the close on February 8) and 2,872.87 (the close on January 26). We ended the quarter at 2,640.87, which is 2.3% above the February low and 8.07% below the January high.
In mid-January, everything seemed expensive. In early February, everything seemed cheap. Now, as I look at the portfolio, many holdings seem undervalued, most obviously the real estate investment trusts. In the table below, I’ve listed the 52-week highs and lows as well as my target prices for adding a few shares and my target prices for trimming a few shares.
One of my goals for 2018 is to increase the cash percentage of the portfolio, but at the moment most stocks seem too cheap to trim. I believe the market has the potential to take out the January highs, but I’m looking for more ups and downs during 2018. The corporate tax cuts should provide a catalyst for strong 2018 earnings, but I’m concerned about the possibility of too aggressive tightening by the Federal Reserve, instability in our national government, and the growing polarization of our populace.
Maintaining a long-term view
Higher volatility brings the opportunity (or the temptation) to buy and sell. When stocks seem overly expensive, I’m willing to trim a few shares to raise the cash position. But my intent is to keep the portfolio essentially intact for the long term.
For several years, I have advocated a focus on dividend growth rather than being overly concerned about fluctuations in market price. That sounds good, and I believe in the concept. But when volatility creates extremes in valuations, it’s easy to get caught up in the euphoria of a rising market or the fear of a falling market.
The portfolio set a new 2018 low in the market selloff on April 2, the first trading day of Q2. At the close, the portfolio was off 9.5% from the January 22 high watermark.
Two major goals for the remainder of 2018
One of my 2018 goals is to raise the portfolio’s cash position. At the end of Q1, the portfolio’s cash position was less than 1%, at 0.97%. As I indicated in my March 18 article, “Thoughts on Cash, Debt, Valuation and Bear Stearns,” in Q2, I expect to add to the portfolio a cash position in a pension account. As of March 29, this would raise the cash position from 0.97% to 13.08%.
My other major goal for 2018 is to raise the exchange-traded funds’ percentage of the portfolio to 20%. This is an aggressive goal because at year-end 2017, ETFs comprised just 5.58% of the portfolio’s market value.
Earlier in Q1, I added shares of the Vanguard FTSE Developed Markets ETF (VEA), the Vanguard Mid-Cap Value ETF (VOE) and the Vanguard Utilities ETF (VPU).
I’ve made three recent purchases of the Vanguard High Dividend Yield ETF (VYM), at $84.25 on March 1, at $82.80 on March 22 and at $80.33 on April 2. At the end of Q1, ETFs represented 10.89% of the portfolio’s value. After the April 2 purchase, ETFs comprised 11.62% of the portfolio.
Portfolio review with price targets
At the end of Q1, the portfolio consisted of 31 individual equities and 7 ETFs.
3/29 was the closing price at quarter-end. %Port is each holding’s percentage of the portfolio market value as of 3/29. Div is the annual dividend or distribution. Yield is the dividend yield as of 3/29. 52 wk is the 52-week price range (as of April 2). Add is my target price to consider adding more shares. Trim is my target price to consider trimming some shares. S&P is the Standard & Poor’s credit rating. For ETFs, the number of Morningstar stars for each ETF is indicated. CCC is the number of consecutive years of dividend increases, per David Fish’s list of Dividend Champions (25+ years), Contenders (10+ years) and Challengers (5+ years). 4/2 was the closing price on April 2, 2018. I have included the closing price on the first trading day of Q2 because of the significant selloff. The 7 ETFs are all Vanguard funds.
| Holding | 3/29 | %Port | Div | Yield | 52 wk | Add | Trim | S&P | CCC | 4/2 |
| Exxon Mobil (XOM) | 74.35 | 3.32% | 3.08 | 4.14% | 72.16-89.30 | 72.47 | 88.63 | AA+ | 35 | 73.22 |
| Pfizer (PFE) | 35.30 | 3.31% | 1.36 | 3.85% | 31.67-39.43 | 32.38 | 38.86 | AA | 8 | 35.05 |
| Johnson & Johnson (JNJ) | 128.41 | 3.30% | 3.36 | 2.62% | 120.95-148.32 | 124.44 | 142.98 | AAA | 55 | 124.56 |
| Microsoft (MSFT) | 91.80 | 3.28% | 1.68 | 1.83% | 64.85-97.24 | 87.27 | 95.86 | AAA | 16 | 88.52 |
| Merck (MRK) | 55.09 | 3.26% | 1.92 | 3.49% | 52.96-66.41 | 53.04 | 65.64 | AA | 7 | 53.27 |
| Apple (AAPL) | 169.29 | 3.21% | 2.52 | 1.49% | 140.06-183.50 | 162.58 | 183.27 | AA+ | 6 | 166.68 |
| Procter & Gamble (PG) | 79.66 | 3.20% | 2.76 | 3.46% | 75.81-94.67 | 76.09 | 93.82 | AA- | 61 | 77.37 |
| Northwest Natural (NWN) | 58.25 | 3.12% | 1.89 | 3.24% | 51.50-69.50 | 51.78 | 68.98 | A+ | 62 | 57.30 |
| Automatic Data (ADP) | 111.76 | 3.12% | 2.52 | 2.25% | 95.50-125.24 | 98.05 | 122.93 | AA | 43 | 113.30 |
| Royal Bk of Canada (RY) | 76.75 | 3.08% | 2.91 | 3.79% | 66.66-87.10 | 70.95 | 86.83 | AA- | 6 | 76.49 |
| Walmart (WMT) | 88.84 | 3.07% | 2.08 | 2.34% | 71.23-109.98 | 85.35 | 109.47 | AA | 45 | 85.55 |
| 3M (MMM) | 219.30 | 2.94% | 5.44 | 2.48% | 188.62-259.77 | 209.23 | 259.05 | AA- | 60 | 212.62 |
| Cisco (CSCO) | 41.85 | 2.90% | 1.32 | 3.15% | 30.36-46.16 | 40.00 | 45.91 | AA- | 8 | 41.01 |
| PepsiCo (PEP) | 109.38 | 2.81% | 3.71 | 3.39% | 105.94-122.51 | 106.00 | 121.84 | A+ | 46 | 107.05 |
| Brookfield Renewable (NYSE:BEP) | 31.20 | 2.79% | 1.96 | 6.28% | 29.08-36.00 | 28.41 | 35.83 | BBB+ | 9 | 30.88 |
| WEC Energy (WEC) | 62.28 | 2.78% | 2.21 | 3.55% | 58.92-70.09 | 58.54 | 69.72 | A- | 15 | 62.29 |
| WP Carey (WPC) | 62.17 | 2.78% | 4.06 | 6.53% | 59.23-72.41 | 59.71 | 71.86 | BBB | 21 | 61.20 |
| Texas Instruments (TXN) | 102.73 | 2.75% | 2.48 | 2.41% | 75.92-120.75 | 99.20 | 119.81 | A+ | 14 | 100.65 |
| Simon Property Grp (SPG) | 153.54 | 2.74% | 7.80 | 5.08% | 147.28-176.17 | 147.52 | 176.07 | A | 9 | 153.08 |
| PPL Corp (PPL) | 28.17 | 2.74% | 1.64 | 5.82% | 27.08-40.20 | 26.24 | 39.71 | A- | 17 | 28.06 |
| Ventas (VTR) | 50.46 | 2.70% | 3.16 | 6.26% | 47.80-72.36 | 48.02 | 71.82 | BBB+ | 8 | 49.39 |
| Enterprise Products (EPD) | 24.07 | 2.69% | 1.70 | 7.06% | 23.10-29.51 | 23.21 | 28.96 | BBB+ | 21 | 24.49 |
| Duke Energy (DUK) | 77.42 | 2.59% | 3.56 | 4.60% | 72.93-91.80 | 73.40 | 90.82 | A- | 13 | 77.10 |
| Kimberly-Clark (KMB) | 110.27 | 2.58% | 4.00 | 3.63% | 104.58-134.29 | 105.12 | 134.91 | A | 46 | 107.09 |
| Realty Income (O) | 51.76 | 2.54% | 2.63 | 5.08% | 47.25-62.31 | 47.35 | 61.84 | BBB+ | 25 | 51.17 |
| Tanger Factory Outlet (SKT) | 22.75 | 2.54% | 1.37 | 6.02% | 21.14-33.68 | 21.09 | 32.93 | BBB+ | 24 | 22.16 |
| National Retail Prop (NNN) | 38.99 | 2.52% | 1.90 | 4.87% | 36.25-45.63 | 36.54 | 44.92 | BBB+ | 28 | 38.64 |
| BCE Inc (BCE) | 42.75 | 2.48% | 2.34 | 5.47% | 42.14-49.06 | 42.17 | 48.88 | BBB+ | 8 | 42.59 |
| Dominion Energy (D) | 67.79 | 2.35% | 3.34 | 4.93% | 66.68-85.30 | 66.80 | 83.92 | BBB+ | 15 | 67.09 |
| Apple Hospitality (APLE) | 17.38 | 2.33% | 1.20 | 6.90% | 16.72-20.19 | 16.72 | 19.83 | NR | 17.34 | |
| Target (TGT) | 69.17 | 2.32% | 2.48 | 3.59% | 48.56-78.70 | 68.04 | 77.96 | A | 50 | 68.98 |
| Equities | 88.14% | 4.08% | ||||||||
| Tot Stk Mkt (VTI) | 133.93 | 0.90% | 2.34 | 1.75% | 119.55-146.87 | 117.15 | NA | 4* | 132.63 | |
| Devel Mkts (VEA) | 43.78 | 2.93% | 1.24 | 2.84% | 38.78-47.89 | 42.84 | NA | 4* | 43.59 | |
| Emerg Mkts (VWO) | 46.14 | 1.03% | 1.06 | 2.29% | 39.26-50.99 | NA | NA | 3* | 46.29 | |
| Hi Div Yld (VYM) | 81.52 | 2.06% | 2.45 | 3.01% | 76.07-90.93 | 79.03 | NA | 5* | 80.64 | |
| Mid-Cp Val (VOE) | 108.05 | 0.75% | 2.07 | 1.92% | 99.64-117.97 | 106.26 | NA | 4* | 107.12 | |
| Real Estate (VNQ) | 75.56 | 2.11% | 3.51 | 4.65% | 72.05-86.14 | NA | NA | 3* | 74.45 | |
| Utilities (VPU) | 111.26 | 1.12% | 3.71 | 3.33% | 104.82-125.54 | NA | NA | 4* | 110.84 | |
| ETFs | 10.89% | 3.07% |
The cash position on 3/29/18 was 0.97%. The portfolio yield was 3.93%. The portfolio was down 5.73% year-to-date and up 31.19% since 12/31/2015.
One stock idea for consideration: Walmart
Part of my allocation strategy is to prioritize additional purchases of individual equities roughly according to their S&P credit rating. I like to keep JNJ, MSFT, XOM and AAPL (credit ratings AAA or AA+) in the top 5. I like to keep WMT, ADP, PFE and MRK (AA rated) in the top ten. I like to keep PG, MMM, CSCO and RY (AA- rated) in the top 15. I like to keep NWN, PEP and TXN (A+ rated) in the top 20. I would like to add more shares of TGT and KMB (A rated).
(Logo from Walmart website)
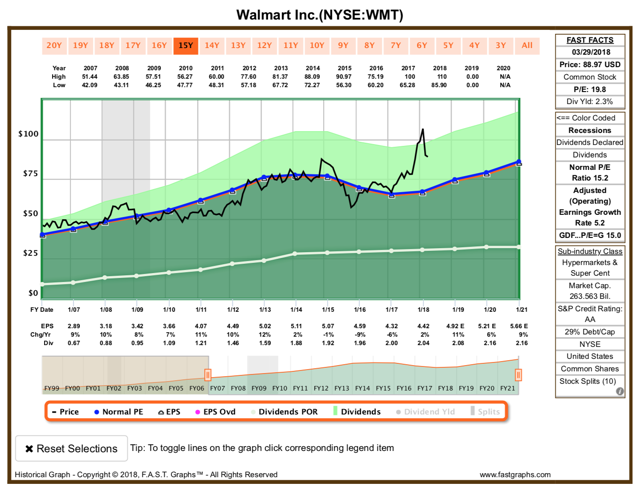
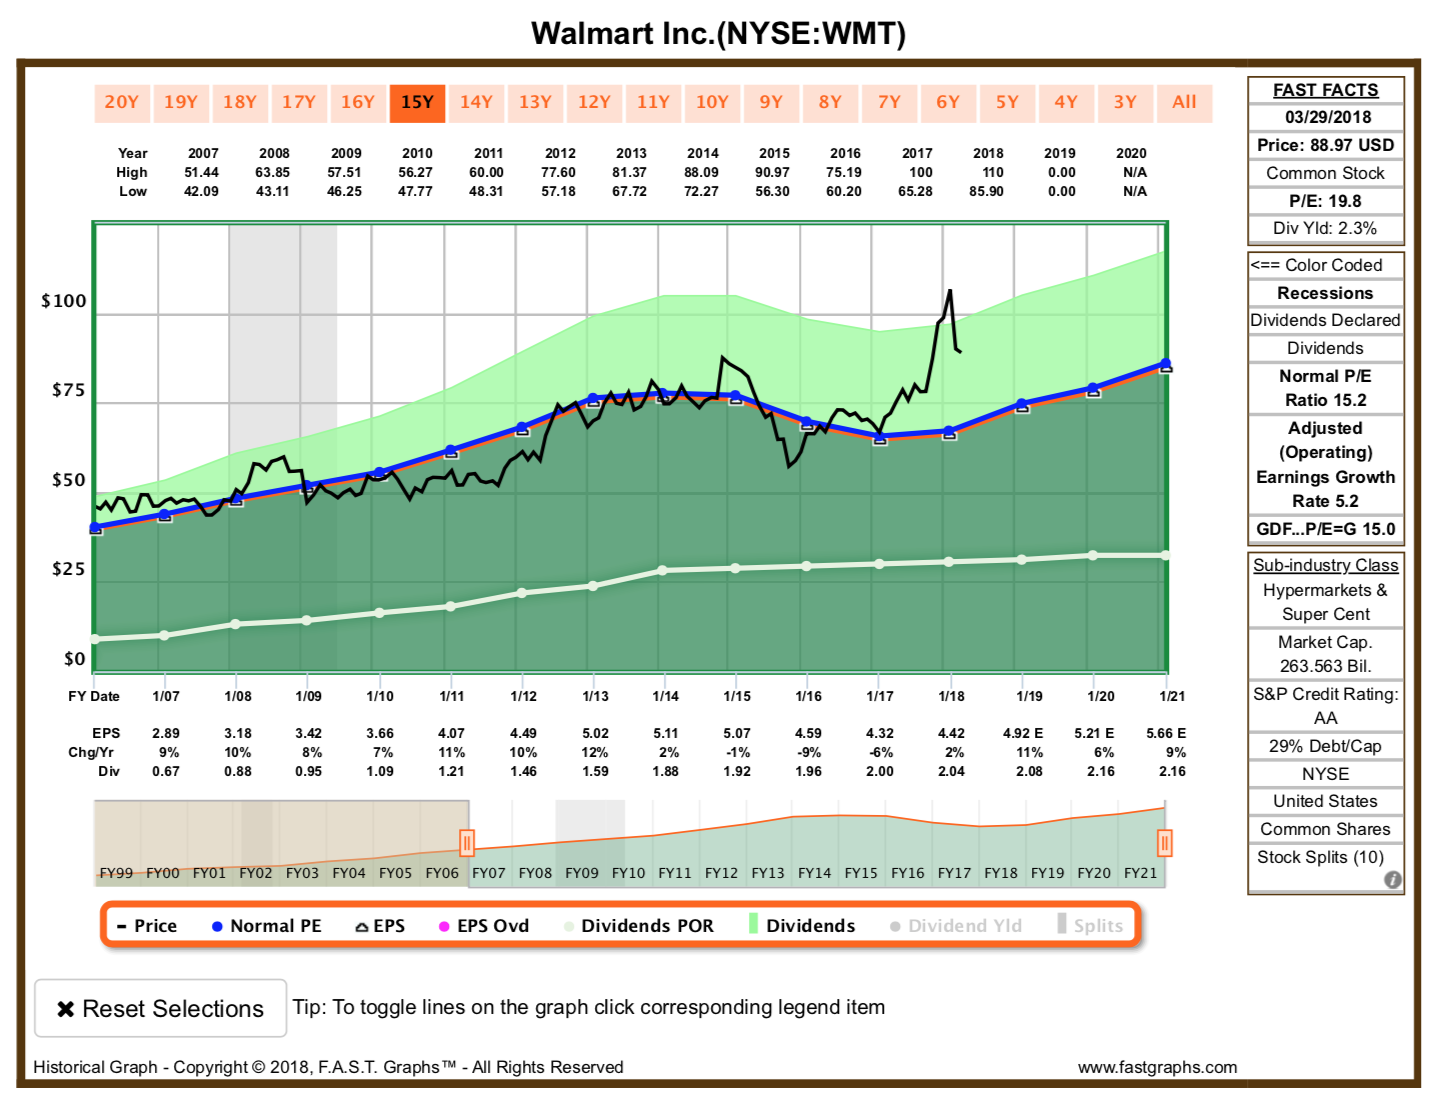
The stock I offer for consideration is Walmart. At the April 2 closing price of $85.55, WMT is 22.2% off its 52-week high of $109.98. It has a rare AA credit rating, awarded by S&P in 1983, and since 1999 the outlook has been stable. WMT has raised the dividend for 45 consecutive years. WMT is in the consumer staples sector (due to its high percentage of grocery sales). This is a utility-like holding, with recent dividend increases in the 2% range.
The graphs below are from F.A.S.T. Graphs.
Today, I bought a few items at a Walmart and noticed a new addition to the store – lockers near the check-out area for “pickup.” There is a drive-through “pickup” area as well, but this one is for walk-in shoppers.
I was surprised to hear that Walmart is interested in acquiring Humana Inc. (HUM). Today, CNBC reported that WMT is also in talks to acquire PillPack, an online pharmacy company. Walmart Chief Executive Officer Doug McMillon is not sitting still. I like the movement toward acquisitions, the steps they’ve taken to improve salaries and benefits for their associates and improvements I’ve seen in the stores. One of the challenges facing WMT is consistency in the shopping experience. The organization is large, with management at the store level a critical variable. I’ve observed some improvement in the morale of personnel. A “walk-about” tends to reveal which stores have superior management. I like the trend toward improvement that I’ve observed, but it is a constant challenge to strive for excellence on so many fronts.
At first, I thought the proposed acquisition of Humana was an “outside the box” idea, but as I look more closely at Humana, I like the idea. My early encounters with Humana were as a hospital operator, but their focus now is the retail health insurance market, particularly for older adults. If you’re like me and not familiar with Humana, you might enjoy the Investor Day Presentation on their website. Here’s Humana’s strategy:
“We strive to improve the health of seniors living with chronic conditions through an Integrated Care Delivery model that brings simplicity and connectivity to the healthcare experience.”
Their primary target group is Medicare participants who are dealing with chronic medical conditions. Their Investor Day Presentation makes it clear that:
“The current health care system is not suited to address the growing need for chronic care management.”
Walmart has the potential to expand its pharmacy operation, its eye care initiatives, and it has the footprint capability to develop more clinical services. This is reminiscent of CVS (NYSE:CVS) moving beyond the pharmacy model to CVSHealth.
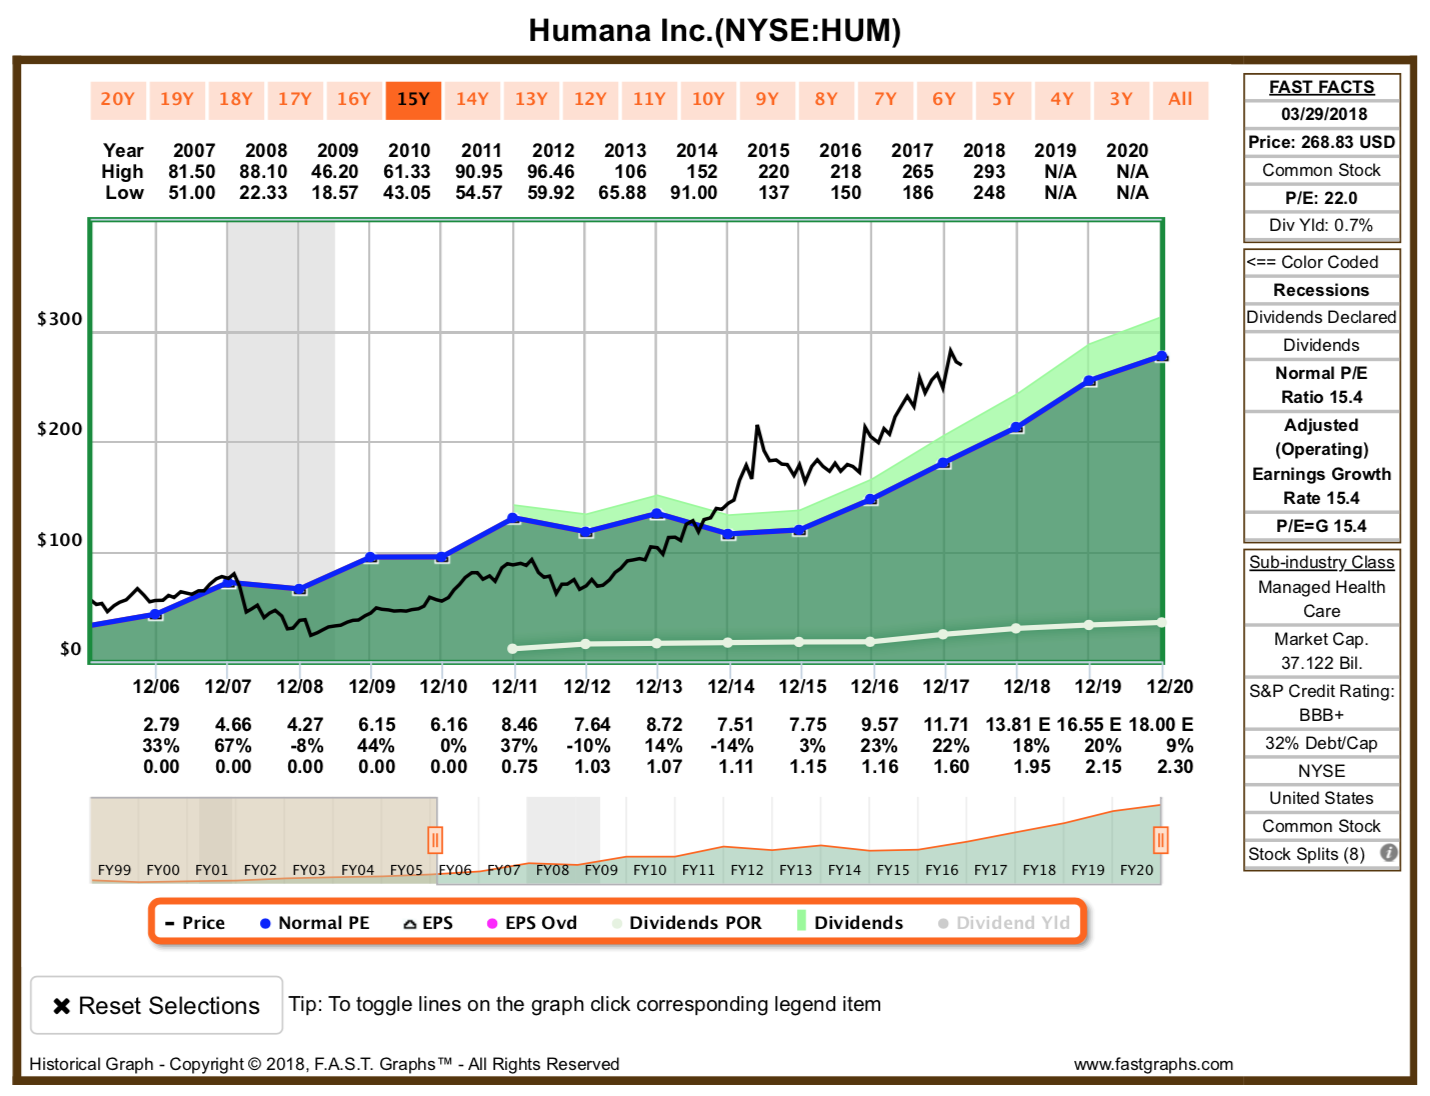
Walmart employs 1.5 million employees in the U.S., and 2.3 million worldwide. Their huge employee base provides opportunities for health care insurance relationships that could cut costs and provide valuable benefits to associates. It’s estimated that 100,000,000 customers shop at Walmart each week. This provides fertile ground for marketing health insurance products.
According a study published by Business Insider, the “average” Walmart shopper is a white, 51-year-old female with an annual household income of $56,482.
The following company research report is from BetterInvesting.org.
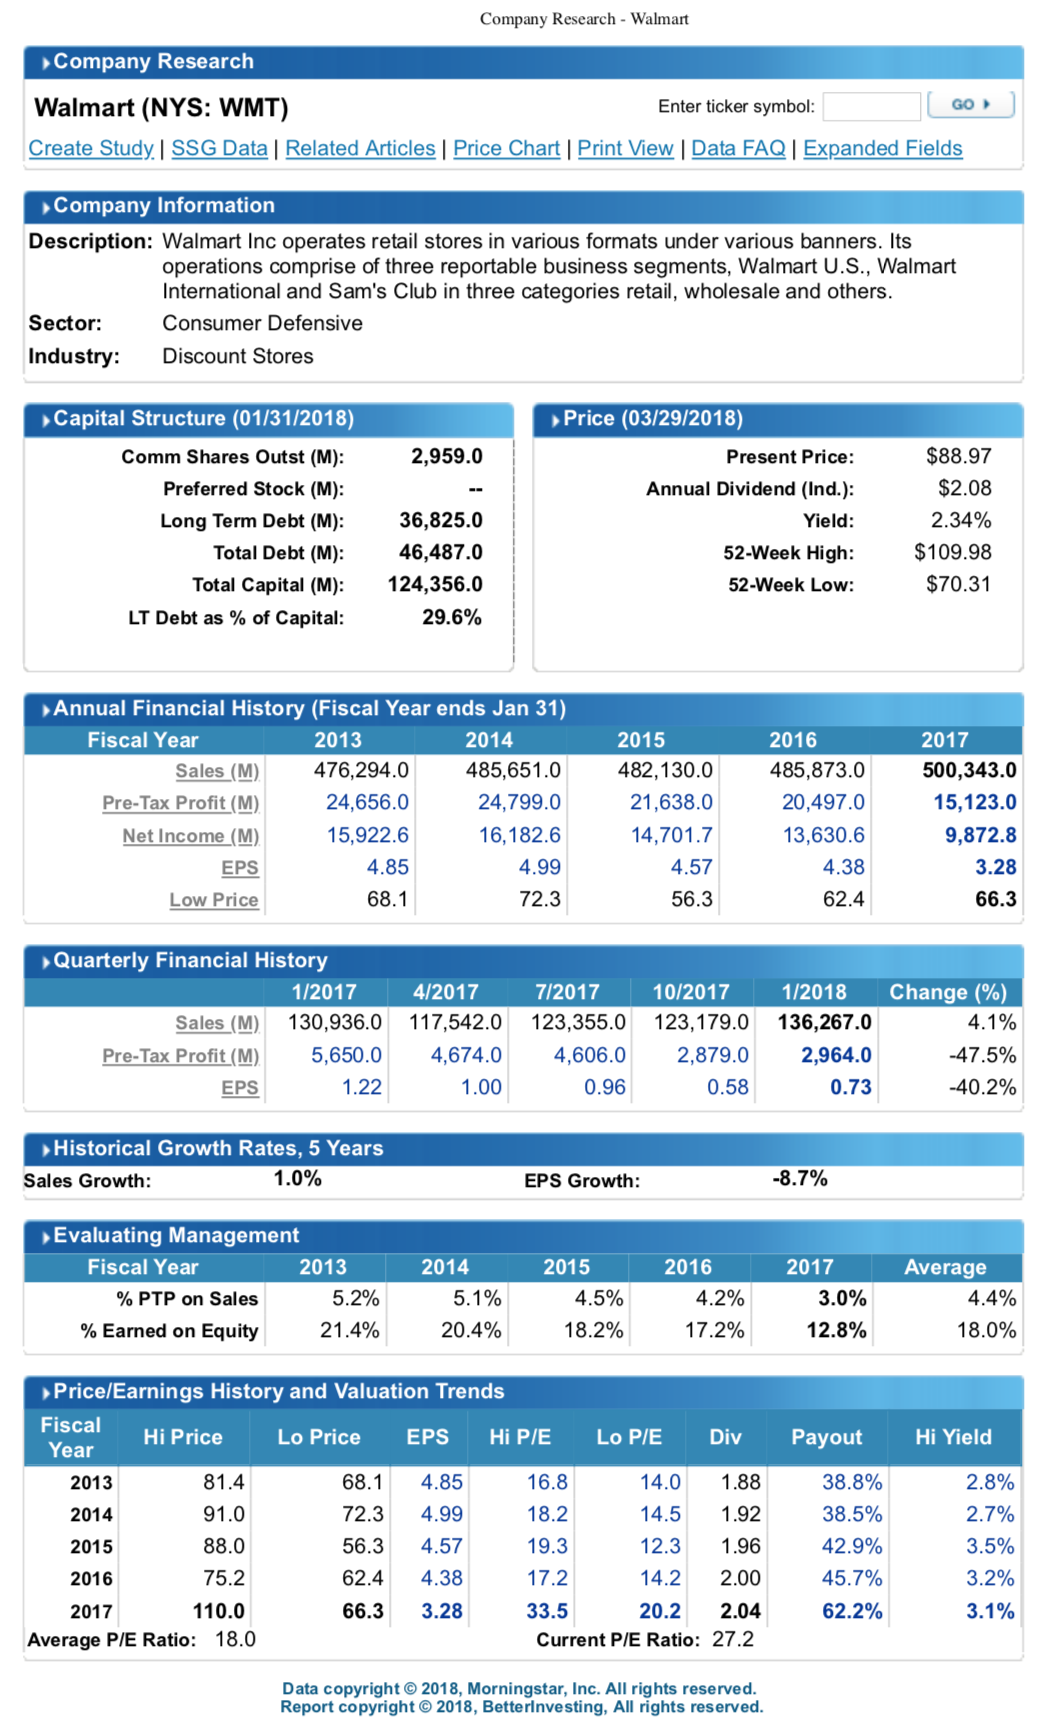
The F.A.S.T. Graph on Walmart indicates that the price is somewhat elevated, which reflects the strong bull market and also WMT’s improving revenues and earnings in recent years – after a long stretch of disappointing results. I like to compare the price line on F.A.S.T. Graphs with the table at the bottom of the BetterInvesting data, particularly the high yields for the past 5 years. WMT’s high yield has been dropping since 2015, from 3.5% in that year to 3.1% in 2017. The current yield, even after the recent 22.2% drop from the 52-week high price is still a relatively low 2.43%.
I initiated the Walmart position in October 2015, at $58.07. The annual dividend at that time was $1.96, for a yield of 3.375%. My current cost basis is $65.92.
The analysis below is from Simply Safe Dividends:
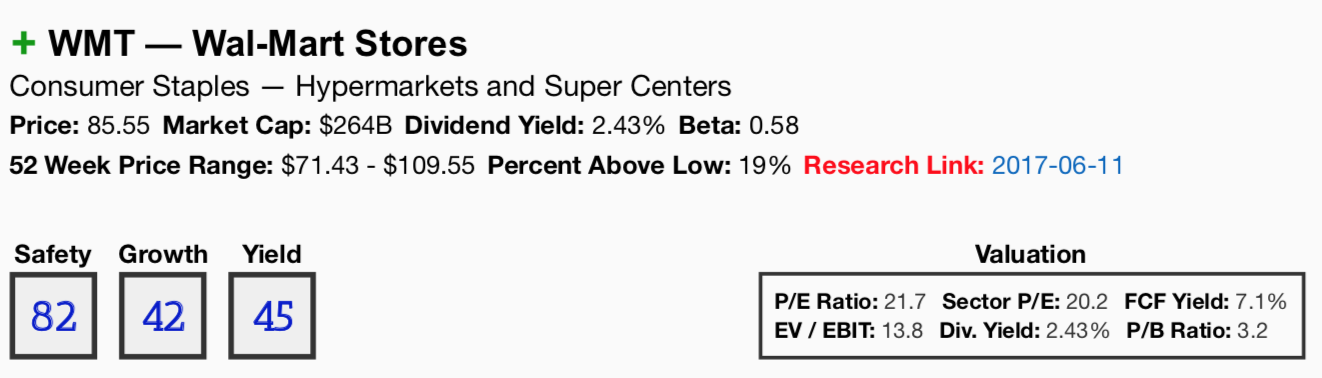
Walmart’s scores at Simply Safe Dividend provide a good snapshot. This is a very strong company with a safe dividend. A score of 50 is average, and while it is a safe dividend, it is a slow-growing dividend with a relatively low yield.
The market has awarded WMT a premium valuation, even after its 22.2% decline from the 52-week high. I may add a few shares to the portfolio position at the current levels. My target “add” price is $85.35. I use Custom Stock Alerts to let me know when a stock has reached my target price.
Obviously, I would prefer to add more shares with a yield north of 3%, but I’m willing to add more at these levels because of the company’s solid performance, financial strength, energetic management and the potential for growth through the possible acquisition of Humana.
I always learn from our Seeking Alpha conversations. I welcome your opinion. Your comments enrich our discussion.
It’s not my intent to advocate the purchase or sale of any security. My purpose is to offer ideas for stocks to study and to share a journal of my effort to design and build a retirement portfolio that puts a priority on relative safety, a history of dividend growth and solid future prospects. Your goals and risk tolerance may differ, so please do your own due diligence.
Disclosure: I am/we are long JNJ, MSFT, XOM, AAPL, WMT, ADP, PFE, MRK, PG, MMM, CSCO, RY, NWN, PEP, TXN, TGT, KMB, SPG, PPL, WEC, DUK, NNN, O, SKT, EPD, D, VTR, BCE, BEP, WPC, APLE, VTI, VEA, VWO, VYM, VOE, VNQ, VPU.
I wrote this article myself, and it expresses my own opinions. I am not receiving compensation for it (other than from Seeking Alpha). I have no business relationship with any company whose stock is mentioned in this article.
Be the first to comment