Focus of Article:
The focus of this article is to provide readers fixed-rate agency mortgage-backed security (“MBS”) price movements during the fourth quarter of 2018 (through 12/15/2018). This includes pricing for both 15- and 30-year fixed-rate agency MBS holdings. Due to the constant fluctuations of mortgage interest rates/U.S. Treasury yields, a growing number of readers have asked that I periodically provide this specific analysis showing how changes in MBS pricing directly impacts portions of the mREIT sector. I believe providing more timely articles of this nature allows readers the ability to pursue more active investing strategies in times of heightened volatility to either enhance one’s total return or minimize one’s total losses.
In addition, I will also include some general (and at times specific) impacts the recent fixed-rate agency MBS pricing fluctuations had on certain mREIT companies. This will typically focus on (but is not limited to) the following fixed-rate agency mREIT companies: 1) AGNC Investment Corp. (AGNC); 2) Arlington Asset Investment Corp. (AI); 3) ARMOUR Residential REIT Inc. (ARR); 4) Cherry Hill Mortgage Investment Corp. (CHMI); 5) Annaly Capital Management Inc. (NLY);and 6) Orchid Island Capital Inc. (ORC). Technically speaking, AI’s current “entity status” is not a REIT per the Internal Revenue Code (“IRC”) but a C-Corporation. However, AI still maintains many “mREIT-like characteristics” including the type of investments held by the company, similar risk management strategies, and the amount of dividend distributions paid to shareholders.
In addition, the following hybrid mREIT companies that I currently cover had at least a modest portion of each company’s investment portfolio in fixed-rate agency MBS (which typically have higher durations): 1) Chimera Investment Corp. (CIM); 2) Dynex Capital Inc. (DX); 3) Invesco Mortgage Capital Inc. (IVR); 4) MFA Financial Inc. (MFA); 5) AG Mortgage Investment Trust Inc. (MITT); 6) Two Harbors Investment Corp. (TWO);and 7) Western Asset Mortgage Capital Corp. (WMC). As such, the analysis below is not solely applicable to one company but more so the fixed-rate agency/hybrid mREIT sector as a whole.
Understanding recent fixed-rate agency MBS price movements is a very important metric when considering a company’s quarterly performance. For this particular article, I will focus on how recent fixed-rate agency MBS price movements have impacted AGNC’s and ORC’s valuation fluctuations. Near the end of this article, I will also provide my projection in regards to AGNC’s and ORC’s CURRENT BV (BV as of 12/15/2018). This quarter, I wanted to provide AGNC’s and ORC’s valuation fluctuations within the same article due to the fact both mREIT companies have fairly similar investing and risk management strategies when it comes to agency MBS.
Fixed-Rate Agency MBS Price Movements for Q4 2018 (Through 12/15/2018):
Using Table 1 below as a reference, let us first analyze the 15-year fixed-rate agency MBS price movements during the fourth quarter of 2018 (through 12/15/2018). This will then be followed by a similar analysis (via Table 2) of the 30-year fixed-rate agency MBS price movements for the same time frame.
Table 1 – 15-Year Fixed-Rate Agency MBS Price Movements (Q4 2018; Through 12/15/2018)
(Source: Table created entirely by myself, using MBS pricing data via private access to a professional resource [Thomson Reuters])
Table 1 above shows the 15-year fixed-rate agency MBS price movements during the fourth quarter of 2018 (through 12/15/2018). It breaks out the 15-year fixed-rate agency MBS holdings by “government-sponsored enterprise/entity” (“GSE”). This includes both Fannie Mae (OTCQB:FNMA) and Freddie Mac (OTCQB:FMCC) MBS. Since Ginnie Mae holdings typically account for only a minor percentage of a company’s investment balance, these fixed-rate agency MBS price movements are deemed immaterial for discussion purposes and thus excluded from this table. Table 1 further breaks out the 15-year fixed-rate agency MBS price movements into the various coupons ranging from 2.5% to 4.5%. Most mREIT companies currently hold an immaterial balance over the 4.5% coupon, and thus, these specific coupons are excluded from Table 1 above.
Using Table 1 as a reference, let us look at the 15-year fixed-rate agency MBS price movements regarding coupon rates where most mREIT companies held a material balance as of 9/30/2018. The cumulative net MBS price movements for each coupon rate are shown within Table 1 under the “Cumulative Quarterly Change” column. For example, during the fourth quarter of 2018 (through 12/15/2018), a Fannie 15-year fixed-rate agency MBS with a 2.5%, 3.0%, 3.5%, 4.0%, and 4.5% coupon had a cumulative net price increase (decrease) of 0.45, 0.27, 0.02, (0.10), and 0.65 to settle its price at 96.83, 99.02, 100.50, 101.83, and 101.78, respectively. As such, a modest price increase occurred on the 2.5%, 3.0%, and 4.5% coupons, a minor price increase occurred on the 3.5% coupon, and a minor decrease occurred on the 4.0% coupon. When compared to Fannie 15-year fixed-rate agency MBS as of 12/15/2018, Freddie 15-year fixed-rate agency MBS had similar net price movements across the 3.0%-4.0% coupons and a less enhanced price increase within the 2.5% and 4.5% coupons (over a 0.10 difference).
Due to the Federal Open Market Committee’s (“FOMC”) more “hawkish” rhetoric on monetary policy during 2018, along with quarterly increases in the Federal (“Fed”) Funds Rate, MBS prices (along with a majority of fixed income investments) have “reversed course” and net decreased during the first, second, and third quarters of 2018. This general trend continued during October 2018 and the first week of November 2018. However, since then, mortgage interest rates/long-term U.S. Treasury yields have modestly reversed course due to renewed worries of the impacts of a U.S./China trade war and the beginning signs of slower global/U.S. economic growth. This has caused mortgage interest rates/U.S. Treasury yields to revert back to levels seen earlier in the year. This trend can be seen in most fixed-rate agency MBS coupons. This is due to the fact MBS prices typically increase when there is a decrease in mortgage interest rates/long-term U.S. Treasury yields (inverse relationship).
Now that we have an understanding of the 15-year fixed-rate agency MBS price movements during the fourth quarter of 2018 (through 12/15/2018), let us take a look at the 30-year fixed-rate agency MBS price movements.
Table 2 – 30-Year Fixed-Rate Agency MBS Price Movements (Q4 2018; Through 12/15/2018)
 (Source: Table created entirely by myself, using MBS pricing data via private access to a professional resource [Thomson Reuters]; link provided below Table 1])
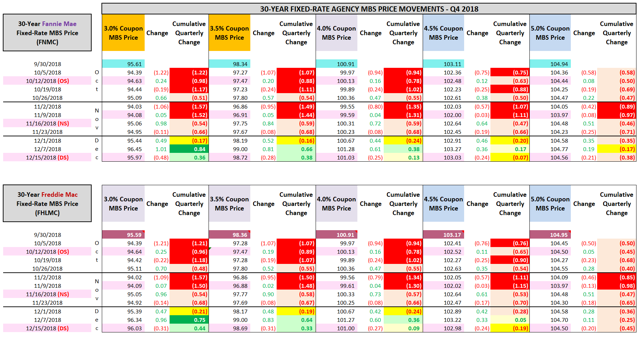
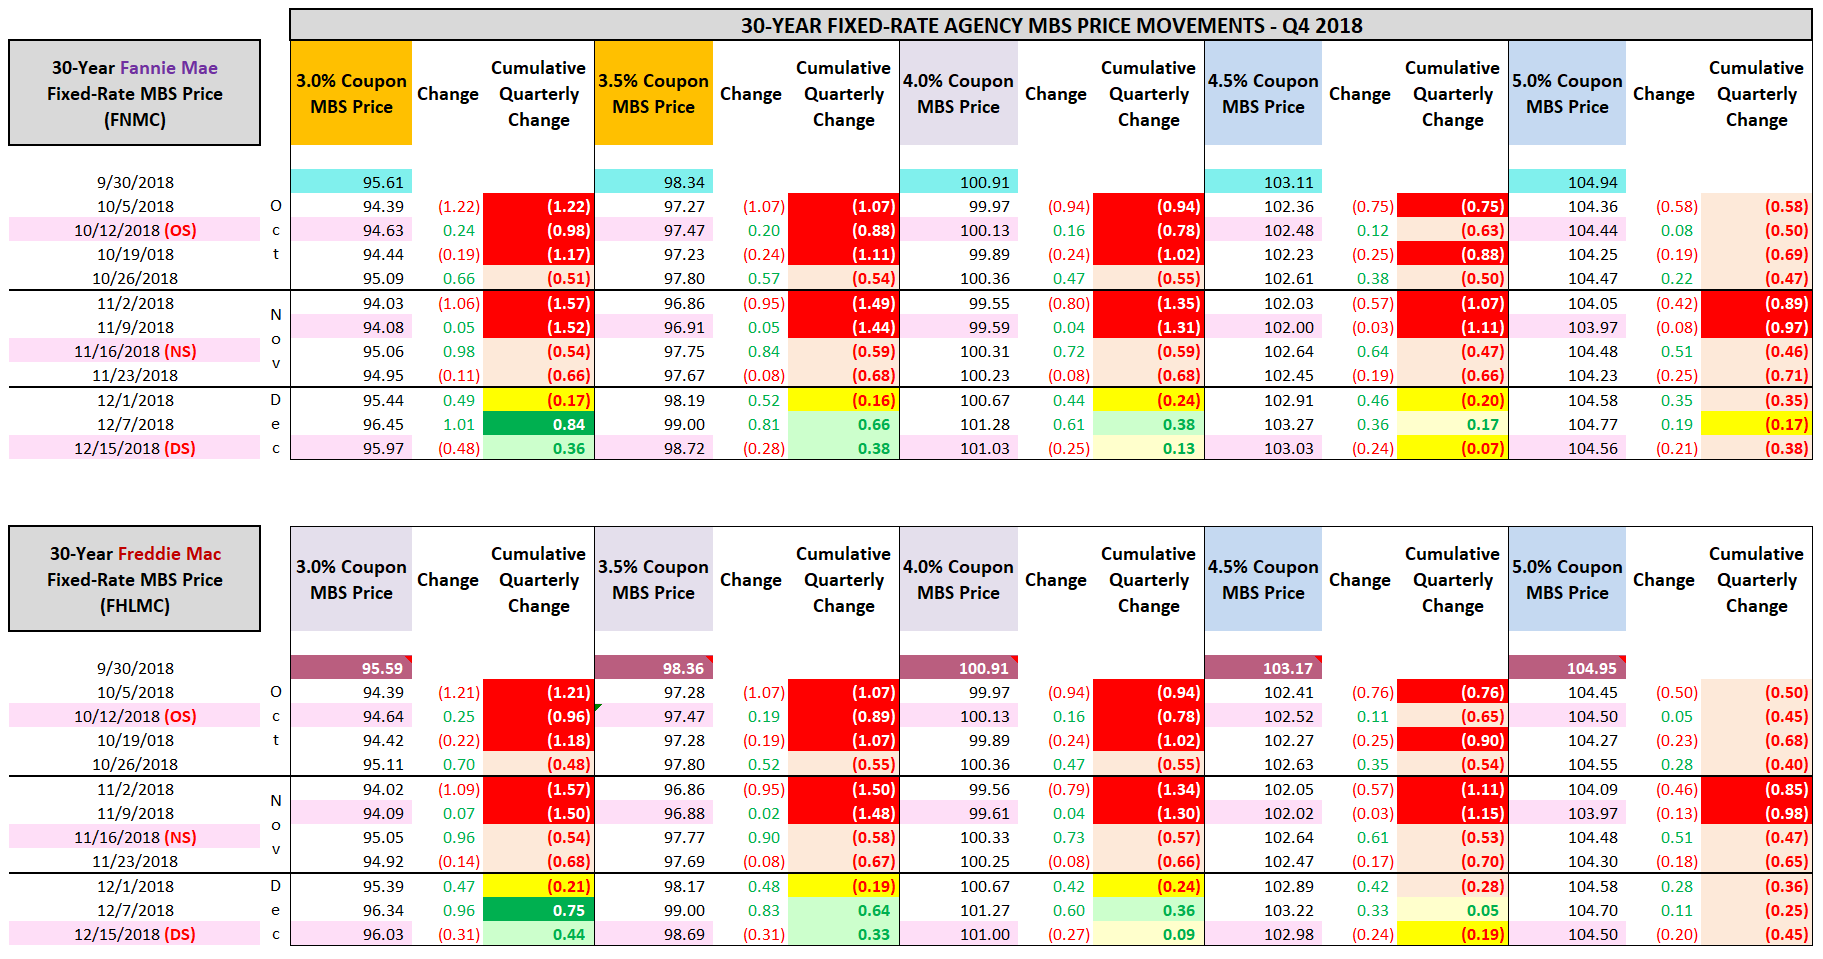
Table 2 above shows the 30-year fixed-rate agency MBS price movements during the fourth quarter of 2018 (through 12/15/2018). It breaks out the 30-year fixed agency MBS holdings by GSE. As was the case with the 15-year fixed-rate agency MBS, this includes both FNMA and FMCC holdings. As stated earlier, most mREIT companies have an immaterial balance of Ginnie Mae fixed-rate agency MBS holdings. As such, these specific MBS are excluded from this table. Table 2 further breaks out the 30-year fixed-rate agency MBS price movements into the various coupons ranging from 3.0% to 5.0%. Most mREIT companies currently hold an immaterial balance over the 5.0% coupon and thus, these specific coupons are excluded from Table 2 above.
Using Table 2 as a reference, let us look at the 30-year fixed-rate agency MBS price movements regarding coupon rates where most mREIT companies held a material balance as of 9/30/2018. For example, during the fourth quarter of 2018 (through 12/15/2018), a Fannie 30-year fixed-rate agency MBS with a 3.0%, 3.5%, 4.0%, 4.5%, and 5.0% coupon had a cumulative net price increase (decrease) of 0.36, 0.38, 0.13, (0.07), and (0.38) to settle its price at 95.97, 98.72, 101.03, 103.03, and 104.56, respectively. As such, a modest price increase occurred on the 3.0% and 3.5% coupons, a minor price increase occurred on the 4.0% coupon, a minor price decrease occurred on the 4.5% coupon, and a modest price decrease occurred on the 5.0% coupon. When compared to Fannie 30-year fixed-rate agency MBS as of 12/15/2018, Freddie 30-year fixed-rate agency MBS had similar net price movements across the 2.5%-4.0% and 5.0% coupons and a more severe price decrease within the 4.5% coupon (over a 0.10 difference).
Now that we have an understanding of the 15- and 30-year fixed-rate agency MBS price movements during the fourth quarter of 2018 (through 12/15/2018), let us take a look at how these price movements (including specified pool considerations) impacted valuations within two particular mREIT companies, AGNC and ORC.
AGNC and ORC Investment/MBS and Derivatives Portfolio Valuation Analysis:
As the first quarter of 2018 progressed, a negative relationship between MBS pricing and derivative instrument valuations (notable widening of spreads) had begun to develop which I highlighted to readers in “real time” as it occurred. This led to most mREIT companies reporting varying levels of BV decreases (which I correctly projected). During the second quarter of 2018, this negative relationship “abated” for the most part. However, a minor-modest negative relationship occurred during the third quarter of 2018.
In particular, I correctly pointed out to readers in last quarter’s MBS pricing/mREIT articles CHMI would outperform its fixed-rate agency mREIT peers when it came to BV fluctuations while AI would likely underperform its fixed-rate agency peers. This projection mainly stemmed from the composition of CHMI’s and AI’s MBS and derivatives portfolios heading into the third quarter of 2018. I also correctly projected both AGNC and ORC were going to report a less than 5% decrease in each company’s quarterly BV during the third quarter of 2018. I also correctly stated AGNC would basically match its agency mREIT peers when it came to BV fluctuations while ORC would slightly underperform its agency peers. This projection mainly stemmed from the composition of AGNC’s and ORC’s MBS and derivatives portfolios heading into the third quarter of 2018.
For instance, AGNC had the following investment/MBS and derivative portfolio characteristics at the beginning of and/or during the third quarter of 2018: 1) higher proportion of 15-year fixed-rate agency maturities versus most fixed-rate agency mREIT peers as of 6/30/2018 and 9/30/2018 (less severe valuation decrease); 2) above average net long “to-be-announced” (“TBA”) MBS position versus most fixed-rate agency mREIT peers during the quarter (proportionately speaking; lowered derivative net valuation gain); and 3) maintained an above average hedging coverage ratio versus the mREIT sector average (including all fixed-rate agency peers except ORC; more enhanced valuation increase). AGNC reported a (2.9%) decrease in quarterly non-tangible BV which was basically the same versus an agency mREIT average of (2.8%); skewed due to CHMI’s quarterly BV gain of 1.3%. AGNC’s quarterly BV decrease outperformed AI, ANH, CMO, NLY, and ORC and underperformed when compared to ARR and CHMI.
ORC had the following investment/MBS and derivative portfolio characteristics at the beginning of and/or during the third quarter of 2018: 1) higher proportion of higher coupon MBS versus most fixed-rate agency mREIT peers as of 6/30/2018 and 9/30/2018 (muted/neutral valuation impact); 2) higher proportion of specified pools versus most fixed-rate agency mREIT peers (slightly more severe valuation decrease); 3) increased an already above average hedging coverage ratio versus the mREIT sector average (including all fixed-rate agency peers; more enhanced valuation increase);and 4) continued underperformance within the company’s interest only (“IO”) and inverse interest only (“IIO”) portfolios. ORC reported a (3.8%) decrease in quarterly BV which was a slight underperformance versus an agency mREIT average of (2.8%); skewed due to CHMI’s quarterly BV gain of 1.3%.
Now, switching gears to the current quarter, a more severe negative relationship occurred during October 2018 and the first week of November. However, the severity of this negative relationship has partially abated with the recent quick reversal to rates/yields during December 2018 (through 12/15/218). The reasoning behind this partial reversal was discussed earlier. Still, the impacts to BV have still been negative on a net basis.
Let us now take a look at my projected valuation fluctuations within AGNC’s and ORC’s investment/MBS and derivatives portfolio during the fourth quarter of 2018 (through 12/15/2018). This analysis is provided in Table 3 below.
Table 3 – AGNC and ORC Investment/MBS and Derivatives Portfolio Valuation Fluctuations (Q4 2018 [Through 12/15/2018] Versus Q3 2018)
 (Source: Table created entirely by myself, including all calculated figures and projected valuations)
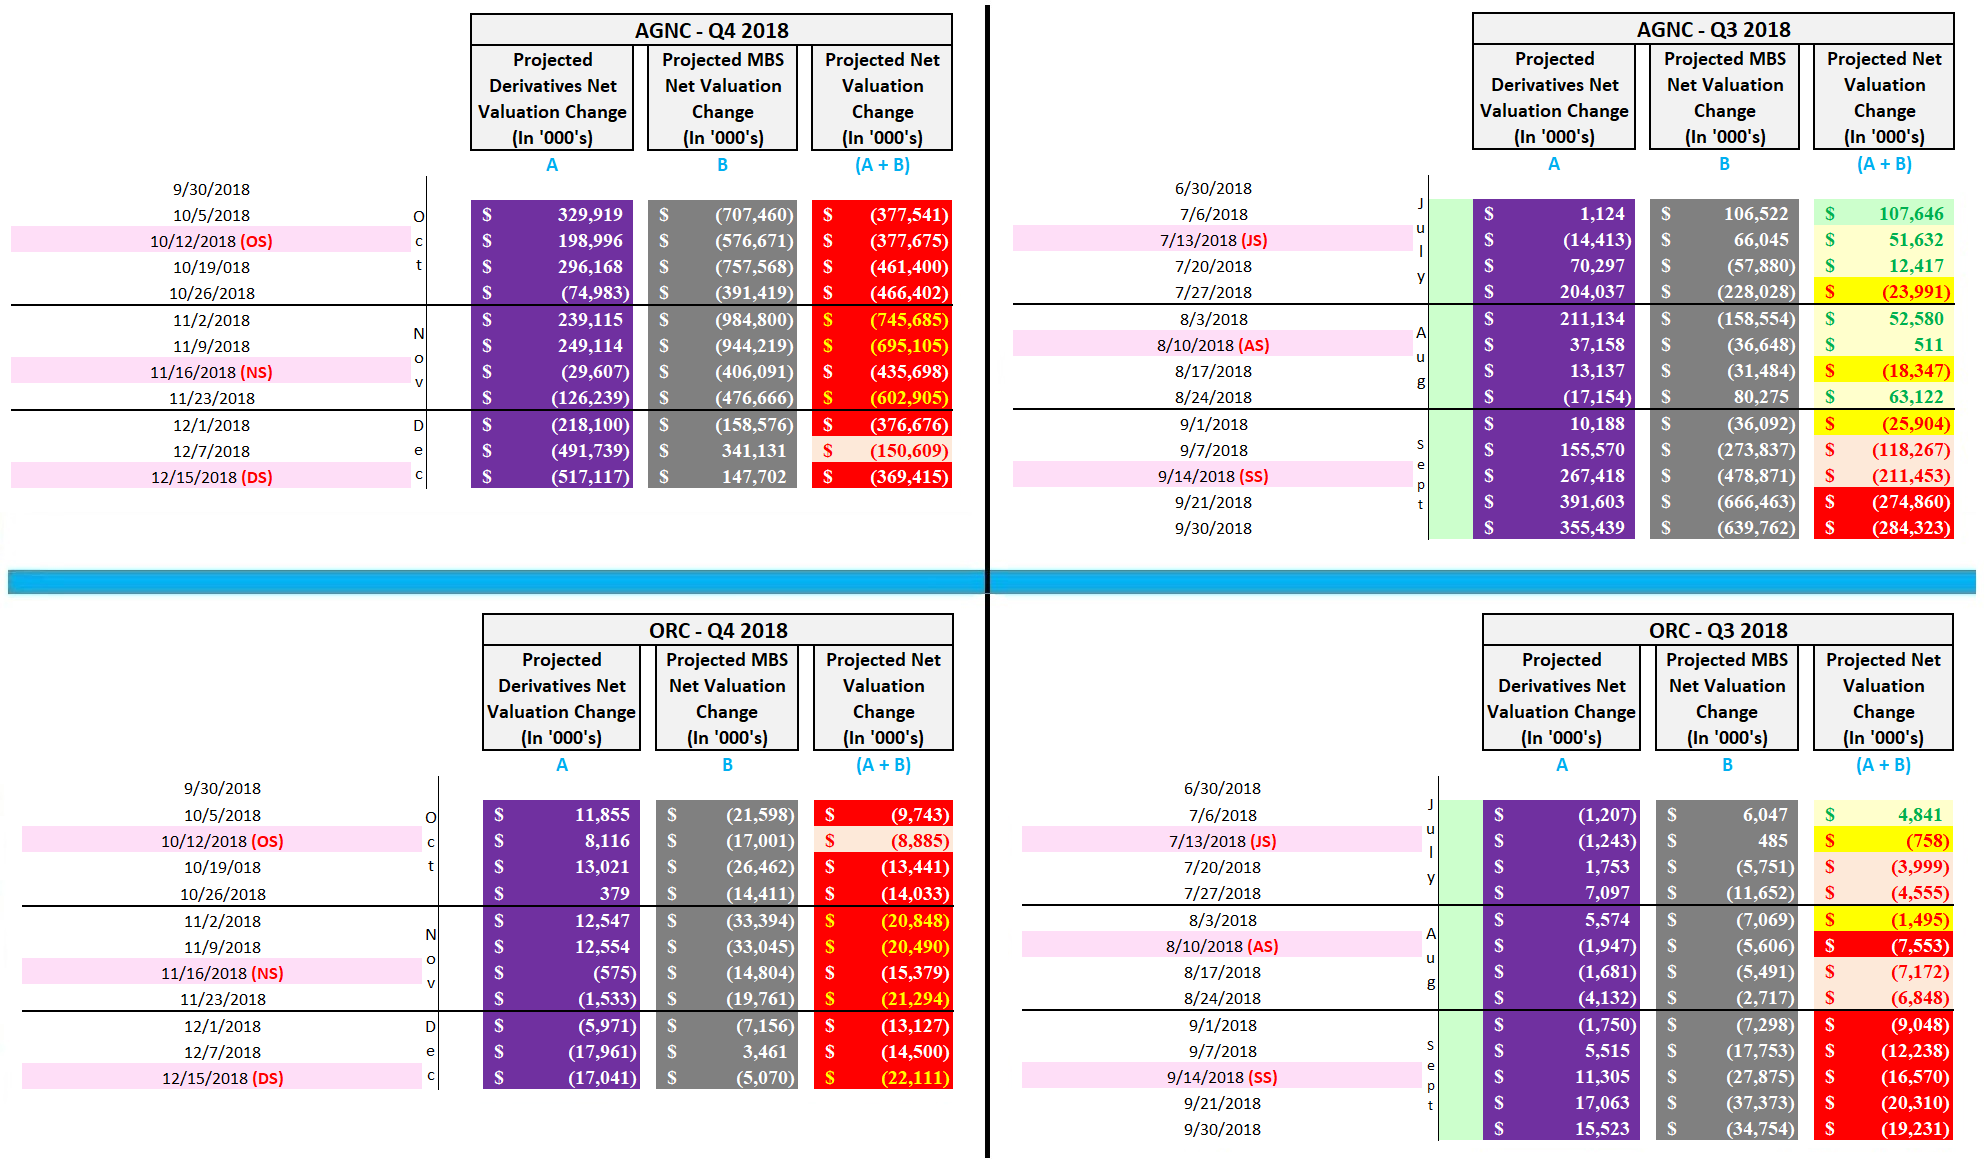
Using Table 3 above as support, let us compare and contrast what has occurred during the fourth quarter of 2018 (through 12/15/2018) versus the prior quarter regarding AGNC’s and ORC’s investment/MBS and derivatives valuation fluctuations. Using the top right-hand portion of Table 3 as a reference, during the third quarter of 2018, I projected AGNC’s investment/MBS and derivatives portfolio had a net valuation loss of ($284) million. This net valuation loss is SOLELY the valuation fluctuations of AGNC’s investment/MBS (including specified pool considerations) and derivatives portfolio and excludes all income and expense accounts. Now using the top left-hand portion, as of 12/15/2018 I am projecting AGNC’s investment/MBS and derivatives portfolio had a net valuation loss of ($369) million. However, as of 11/2/2018, I projected this net valuation loss was as large as ($746) million. Simply put, mainly due to the anticipation of the FOMC’s 25 basis point (“bp”) increase to the Fed Funds Rate on Wednesday, along with an uncertainty which direction interest rates are generally heading (with the more recent pessimistic sentiment regarding the U.S. economy), a more negative relationship between MBS pricing and derivative instrument valuations has occurred throughout the quarter (with varying levels of severity).
Some new readers of my articles may wonder how close my previous projections have been when compared to actual results within the mREIT sector. As such, I will provide some quick “projected versus actual” results when it comes to each company’s valuation fluctuations. AGNC reported a combined investment/MBS and derivatives net valuation loss of ($15), ($408), ($15), and ($166) million during the fourth quarter of 2017, first quarter of 2018, second quarter of 2018, and third quarter of 2018, respectively. In comparison, I projected (within quarterly mREIT articles) AGNC’s investment/MBS and derivatives portfolio had a net valuation gain (loss) of $30, ($324), ($10), and ($283) million (rounded), respectively.
As such, I believe all four projections were fairly close-very close to AGNC’s reported results (only a $45, $84, $5, and $117 million variance, respectively). The modestly larger variance during the third quarter of 2018 was due to the fact AGNC decreased the company’s previously very large net long TBA MBS position by an amount greater than I anticipated (basically cut the position in half; was wise as rates/yields net increased towards the end of the quarter) and a larger than anticipated increase in its net (short) U.S. Treasuries position. It should be pointed out, during this time frame, AGNC’s investment/MBS and derivatives portfolio had a fair market value (“FMV”) of $58-73 billion and a notional balance of $69-72 billion, respectively. Simply put, each quarter’s variance was fairly small-very small.
Next, using the bottom right-hand portion of Table 3 as a reference, during the third quarter of 2018 I projected ORC’s investment/MBS and derivatives portfolio had a net valuation loss of ($19) million. This net valuation change is SOLELY the valuation fluctuations of ORC’s investment/MBS (including specified pool considerations and the company’s “premium lost due to paydowns” figure) and derivatives portfolio and excludes all income and expense accounts. Now using the bottom left-hand portion, as of 12/15/2018 I am projecting ORC’s investment/MBS and derivatives portfolio had a net valuation loss of ($22) million. Unlike AGNC, I would point out this fluctuation is only slightly more severe when compared to the prior quarter (still a negative relationship though). This is mainly due to the fact ORC has most of the company’s derivative instruments towards the shorter-end of the yield curve. Simply put, shorter-term derivative instruments have experienced less severe valuation losses (in some cases still a valuation gain) when compared to intermediate- and longer-term derivative instruments during the fourth quarter of 2018 (through 12/15/2018).
I will provide some quick projected versus actual results when it comes to ORC’s valuation fluctuations over the past several quarters (for additional credibility). ORC reported a combined investment/MBS and derivatives net valuation loss of ($30), ($38), ($18), and ($20) million during the fourth quarter of 2017, first quarter of 2018, second quarter of 2018, and third quarter of 2018, respectively. In comparison, I projected ORC’s investment/MBS and derivatives portfolio had a net valuation loss of ($30), ($29), ($19), and ($19) million, respectively. As such, I believe all four projections were either very close or an identical match to ORC’s reported results (only a $0, $9, $1, and $1 million variance, respectively).
As Table 3 above shows, the relationship between MBS pricing and derivative instrument valuations constantly changes. As such, one needs to be constantly vigilant. An unfavorable relationship between MBS pricing and derivative instrument valuations is always a possibility in the mREIT sector and is termed “spread/basis risk”. While companies can take steps to “minimize” spread/basis risk, a company can never completely “mitigate” this risk. For instance, there was a notable widening of “option adjusted spreads” (“OAS”) during the fourth quarter of 2016, first quarter of 2018, and most recently, the first half of the fourth quarter of 2018. This more recent heightened spread/basis risk was basically the result of the FOMC’s more hawkish stance on future monetary policy (potential additional Fed Funds Rate increases during 2019).
Conclusions Drawn:
This article provided to readers fixed-rate agency MBS price movements during the fourth quarter of 2018 (through 12/15/2018). After a very negative relationship between MBS pricing and derivative instrument valuations during the first quarter of 2018 (notable widening of spreads), a more muted/less negative relationship occurred during second quarter of 2018. A minor-modest negative relationship occurred during third quarter of 2018.
Once again, a more severe negative relationship existed during October 2018 and the first week of November 2018. However, since then, mortgage interest rates/long-term U.S. Treasury yields have modestly reversed course due to renewed worries of the impacts of a U.S./China trade war and the beginning signs of slower global/U.S. economic growth. This has caused mortgage interest rates/U.S. Treasury yields to revert back to levels seen earlier in the year. This has also partially decreased the severe negative relationship that occurred earlier in the fourth quarter of 2018. However, readers should still be aware most sector peers will report a quarterly decrease in BV (especially agency mREIT peers).
I believe AGNC will basically match the company’s fixed-rate agency mREIT peers during the fourth quarter of 2018 when it comes to BV fluctuations, while ORC will slightly modestly outperform its fixed-rate agency mREIT peers. Through a detailed analysis that will be omitted from this particular article, I am projecting AGNC’s and ORC’s non-tangible BV and BV as of 12/15/2018 was approximately $18.00 and $7.25 per common share, respectively. This calculates to a decrease of (5.8%) and (4.1%) when compared to each company’s BV as of 9/30/2018, respectively. This projection excludes AGNC’s and ORC’s $0.18 and $0.08 per common share dividend for December 2018, respectively (ex-dividend date has yet to occur).
My BUY, SELL, or HOLD Recommendation:
From the analysis provided above, including additional catalysts/factors not discussed within this particular article, I currently rate AGNC as a SELL when I believe the company’s stock price is trading above my projected non-tangible CURRENT BV (BV as of 12/15/2018; $18.00 per share), a HOLD when trading at through less than a (7.5%) discount to my projected non-tangible CURRENT BV, and a BUY when trading at or greater than a (7.5%) discount to my projected non-tangible CURRENT BV. These ranges are unchanged when compared to my last AGNC article (approximately 1.5 months ago).
Therefore, I currently rate AGNC as a HOLD since the stock is trading at through less than a (7.5%) discount to my projected non-tangible CURRENT BV. As such, I currently believe AGNC is appropriately valued from a stock price perspective (not overvalued, not undervalued). My current price target for AGNC is approximately $18.00 per share. This is currently the price where my HOLD recommendation would change to a SELL. The current price where my recommendation would change to a BUY is approximately $16.65 per share.
From the analysis provided above, including additional catalysts/factors not discussed within this article, I currently rate ORC as a SELL when I believe the company’s stock price is trading at or greater than a 2.5% premium to my projected CURRENT BV (BV as of 12/15/2018; $7.25 per share), a HOLD when trading at or less than a 2.5% premium through less than a (7.5%) discount to my projected CURRENT BV, and a BUY when trading at or greater than a (7.5%) discount to my projected CURRENT BV. These ranges are unchanged when compared to my last ORC article (approximately three months ago).
Therefore, I currently rate ORC as a BUY. As such, I currently believe ORC is undervalued from a stock price perspective. My current price target for ORC is approximately $7.45 per share. This is currently the price where my recommendation would change to a SELL. When calculated, this would be price appreciation of approximately 23% from ORC’s closing stock price of $6.07 per share as of 12/17/2018. The current price where my recommendation would change to a HOLD is approximately $6.70 per share.
Along with the data presented within this article, this recommendation considers the following mREIT catalysts/factors: 1) projected future MBS price movements; 2) projected future derivative valuations; and 3) projected near-term dividend per share rates. This recommendation also considers the probability of four Fed Funds Rate increases by the FOMC during 2018 (this is a more hawkish view when compared to most of last year) and several increases during 2019 due to recent macroeconomic trends/events. This also considers the eventual “wind-down”/decrease of the Fed’s balance sheet through gradual “runoff”/partial non-reinvestment (which began in October 2017 which has increased spread/basis risk).
Final Note: Each investor’s BUY, SELL, or HOLD decision is based on one’s risk tolerance, time horizon, and dividend income goals. My personal recommendation will not fit each reader’s current investing strategy. The factual information provided within this article is intended to help assist readers when it comes to investing strategies/decisions.
Current/Recent mREIT Sector Stock Disclosures:
On 2/9/2018, I re-entered a position in ORC at a weighted average purchase price of $6.845 per share. This weighted average per share price excluded all dividends received/reinvested. On 7/17/2018, I sold my entire position in ORC at a weighted average sales price of $8.042 per share as my price target, at the time, of $8.05 per share was met. This calculates to a non-annualized realized gain of 17.5% in roughly 5 months and a non-annualized total return (when including dividends received) of 24.4%. Each ORC trade was disclosed to readers in real time (that day) via the StockTalks feature of Seeking Alpha.
On 10/26/2018, I re-entered a position in ORC at a weighted average purchase price of $6.388 per share. On 12/18/2018, I increased my position in ORC at a weighted average price of $6.215 per share. When combined, my ORC position has a weighted average purchase price of $6.273 per share. Each ORC trade was disclosed to readers in real time (that day) via the StockTalks feature of Seeking Alpha.
On 1/31/2017, I initiated a position in New Residential Investment Corp. (NRZ) at a weighted average purchase price of $15.10 per share. On 6/29/2017 and 7/7/2017, I increased my position in NRZ at a weighted average purchase price of $15.775 and $15.18 per share, respectively. When combined, my NRZ position has a weighted average purchase price of $15.349 per share. This weighted average per share price excludes all dividends received/reinvested. Each NRZ trade was disclosed to readers in real time (that day) via the StockTalks feature of Seeking Alpha. I currently have a BUY recommendation on NRZ.
On 6/29/2017, I initiated a position in CHMI at a weighted average purchase price of $18.425 per share. On 10/6/2017, 10/26/2017, 11/6/2017, 1/29/2018, and 10/12/2018 I increased my position in CHMI at a weighted average purchase price of $18.015, $18.245, $17.71, $17.145, and $17.235 per share, respectively. When combined, my CHMI position has a weighted average purchase price of $17.585 per share. This weighted average per share price excludes all dividends received/reinvested. Each CHMI trade was disclosed to readers in real time (that day) via the StockTalks feature of Seeking Alpha. I currently have a BUY recommendation on CHMI.
On 8/23/2017, I initiated a position in TWO’s Series B preferred stock, (TWO.PB). On 8/24/2017, I increased my position in TWO-B. When combined, my TWO-B position has a weighted average purchase price of $25.283 per share. Each TWO-B trade was disclosed to readers in real time (that day) via the StockTalks feature of Seeking Alpha.
On 8/31/2017, I initiated a position in CHMI’s Series A preferred stock, (CHMI.PA). On 9/12/2017, I increased my position in CHMI-A. When combined, my CHMI-A position has a weighted average purchase price of $25.198 per share. Each CHMI-A trade was disclosed to readers in real time (that day) via the StockTalks feature of Seeking Alpha.
On 1/29/2018, I initiated a position in TWO at a weighted average purchase price of $15.155 per share. This weighted average per share price excludes all dividends received/reinvested. This TWO trade was disclosed to readers in real time (that day) via the StockTalks feature of Seeking Alpha. I currently have a HOLD recommendation on TWO.
On 3/1/2018, I initiated a position in CYS Investments Inc. (CYS) at a weighted average purchase price of $6.34 per share. This weighted average per share price excluded all dividends received/reinvested. On 6/18/2018, I sold my entire position in CYS at a weighted average sales price of $7.515 per share as my price target, at the time, of $7.50 per share was met. This calculates to a non-annualized realized gain of 18.5% in roughly 3.5 months and a non-annualized total return (when including dividends received) of 22.0%. Each CYS trade was disclosed to readers in real time (that day) via the StockTalks feature of Seeking Alpha.
On 3/8/2018, I initiated a position in New York Mortgage Trust’s (NYMT) Series D preferred stock (NYMTN). On 4/6/2018, 4/27/2018, 10/12/2018, and 12/18/2018, I increased my position in NYMTN. When combined, my NYMTN position has a weighted average purchase price of $23.045 per share. This weighted average per share price excludes all dividends received/reinvested. Each NYMTN trade was disclosed to readers in real time (that day) via the StockTalks feature of Seeking Alpha.
On 10/12/2018, I initiated a position in Granite Point Mortgage Trust (GPMT) at a weighted average purchase price of $18.155 per share. This weighted average per share price excludes all dividends received/reinvested. This GPMT trade was disclosed to readers in real time (that day) via the StockTalks feature of Seeking Alpha. I currently have a BUY recommendation on GPMT.
On 10/12/2018, I initiated a position in MITT at a weighted average purchase price of $17.105 per share. This weighted average per share price excludes all dividends received/reinvested. This MITT trade was disclosed to readers in real time (that day) via the StockTalks feature of Seeking Alpha. I currently have a BUY recommendation on MITT.
All trades/investments I have performed over the past few years have been disclosed to readers in real time (that day at the latest) via the StockTalks feature of Seeking Alpha (which cannot be changed/altered). Through this resource, readers can look up all my prior disclosures (buys/sells) regarding all companies I cover here at Seeking Alpha (see my profile page for a list of all stocks covered). Through StockTalk disclosures, at the end of November 2018, I had an unrealized/realized gain “success rate” of 84.6% and a total return (includes dividends received) success rate of 100% out of 39 positions (updated monthly; see my profile for more detailed investing statistics). The slight decrease in the first percentage, when compared to September 2018, was due to the fact my position in three mREIT preferred stocks recently turned slightly negative (when excluding dividends received; still had a total return). I encourage other Seeking Alpha contributors to provide real time buy and sell updates for their readers which would ultimately lead to greater transparency/credibility.
Author’s Note: Starting in 2019, I will be “teaming up” per se with Colorado Wealth Management to provide additional data/insight within the mortgage real estate investment trust (mREIT) sector. While I currently cover 20 mREIT peers (which includes having detailed modeling/valuation projections for each company), due to time constraints via my professional career and analysis of other stocks/sectors, I cannot provide detailed coverage for each mREIT company in a quarterly “solo” article. As such, through this new collaboration, I will be providing intra-quarter CURRENT book value (“BV”) per share projections on all 20 mREIT stocks I currently cover. This will likely consist of weekly BV projections for all agency mREIT companies I cover and monthly BV projections for all hybrid/multipurpose mREIT companies I cover. A list of all stocks I cover at Seeking Alpha (S.A.) is provided within my profile page. This very informative (and “premium”) information/projections will be provided through Colorado’s existing SA Marketplace service.
Having access to this premium data should help readers enhance one’s total return or minimize one’s total losses by pursuing a more active investing strategy. For more passive investors, I believe providing this highly useful information, which is not readily available to the public, will provide valuable insight into the mREIT sector and help readers better understand recent, current, and future projected trends. This new service will only have a minimal impact to my existing mREIT coverage and no impact on my existing business development company (“BDC”)/other sector coverage. This will also not impact my real-time stock purchases and sales disclosures which I provide to readers through the StockTalks feature of SA.
Disclosure: I am/we are long ORC, CHMI, CHMI.PA, GPMT, MITT, NRZ, NYMTN, TWO, TWO.PB. I wrote this article myself, and it expresses my own opinions. I am not receiving compensation for it (other than from Seeking Alpha). I have no business relationship with any company whose stock is mentioned in this article.
Additional disclosure: I currently have no position in AGNC, AI, ARR, CIM, DX, FMCC, FNMA, IVR, MFA, MORL, NLY, NYMT, REM, or WMC.
Be the first to comment