
In my last article on November 12th, I was bullish on the U.S. dollar (UDN, UUP), as I expected it to rise against the Canadian dollar (FXC, CADS). This came true, as the greenback rose till the anticipated level of 1.3298. However, I now believe the greenback will be falling against the Canadian dollar, which will result in it reaching the 1.3251 mark. To establish the likelihood of this occurring, I will look at the fundamental news affecting the pair whilst also analyzing the charts using technical analysis tools.
Fundamental news
U.S. Yield Curve
I expect the U.S. dollar to have a decline in its value due to the ongoing bullish run coming under pressure from the curve inversion seen in Treasury yields. This is due to the spread between the 5-year and 2-year Treasury yield turning towards the downside. Moreover, I expect the situation to worsen for the U.S. dollar if the spread between the 10-year and 2-year Treasury yield turns negative. This would trigger a constant flow of funds from the U.S. dollar’s piggybank to other assets such as gold.
Jittery U.S. Jobs Report
The latest U.S. jobs report does not instill confidence into any trader that is bullish on the U.S. dollar. The number of jobs in November rose by 155,000, which is significantly lower than the analyst estimate of 200,000. This is also a significant decline from the prior month’s value of 237,000. The bullish sentiment is further weakened as the wage growth level came in at 0.2% in November against an analyst estimate of 0.3%. Thus, I believe this will have a bearish impact on the greenback for quite some time.
Canadian Statistics
The recently released housing starts data has offered the Canadian bulls with a glimmer of hope. I say this as the housing starts statistic for November came in at 215,900 units, which is higher than the market estimate of 196,000 units. This is excellent news for the Canadian dollar as it is the largest increase seen since June 2018. The multiple urban starts rose by 3.9% to 151,596 units. Due to this, I expect the Canadian dollar to rise against the greenback in the coming days.
Trade War
I expect the trade war to continue affecting the U.S. dollar’s value in the coming days. The decision made by the United States to order the arrest of Huawei’s CFO will greatly affect the value of the U.S. dollar. It throws into doubt the hope of a constructive negotiation with China over the trade war.
Technical analysis
Daily chart
The pair’s daily chart indicates that the U.S. dollar’s bullish run has come to an end. I say this because the greenback has reached a long-term candle resistance level. This level has been tested numerous times in 2018 and has been always been successful in stopping the U.S. dollar from having a breakout. The pair has formed a “Tweezer Top” candle pattern, which indicates to investors that there is slackening in demand levels. The last nail in the bull’s coffin is placed due to the pair extending to the 161.8% Fibonacci resistance level at 1.3385. This provides confirmation to traders that a bearish reversal is underway.
On the price target front, I expect the U.S. dollar to fall till the range between the 100% and 127.2% Fibonacci support levels. The 100% Fibonacci support level is at 1.3249 whilst the 127.2% support level is at 1.3196. However, if the greenback does breach the 127.2% Fibonacci support level, then I do not expect the fall to go beyond the 161.8% Fibonacci support level at 1.3128.
On the indicator facet, the RSI has commenced a descent, which has resulted in it breaking below the 50 mark. This supports my notion that the U.S. dollar will be tumbling till the range between the 100% and 127.2% Fibonacci support levels. The ADX has turned flat, signaling to investors that the bullish rally has stalled.
Weekly chart
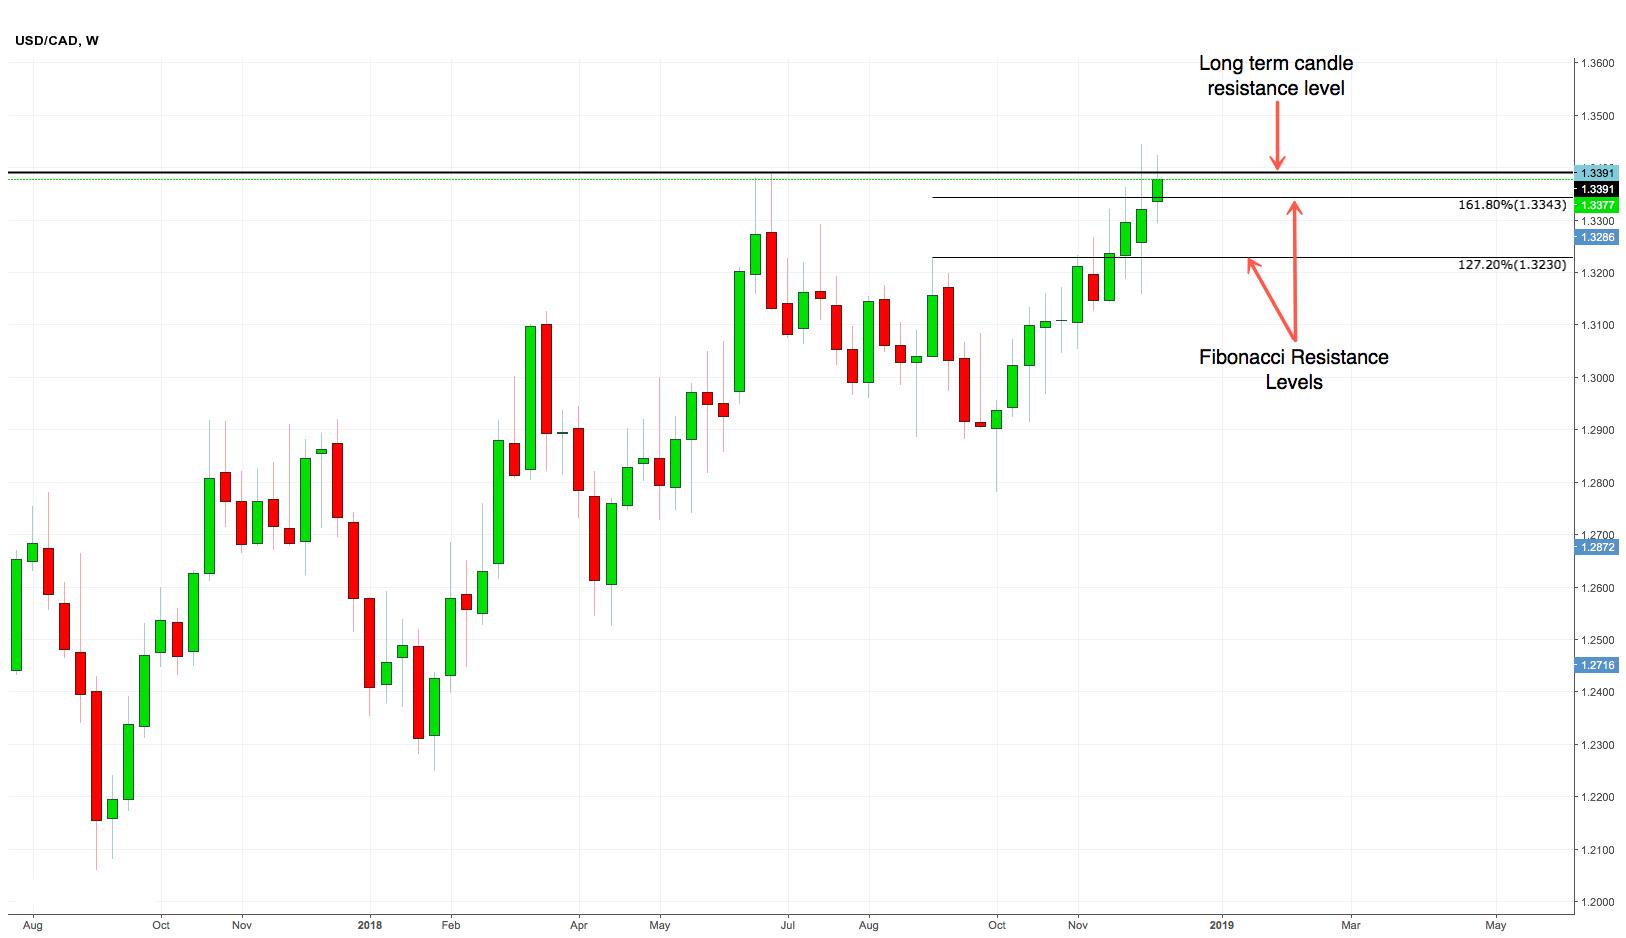
The pair’s weekly chart indicates that the bullish rally is slowing down. The U.S. dollar has reached the long-term candle resistance level at 1.3391. At this level, the pair has formed a “High Wave” candle pattern, which indicates to investors that the market is confused. The pattern received bearish confirmation as it has formed at the 161.8% Fibonacci resistance level at 1.3343. This indicates to investors that the bullish run is extremely overextended, and due to this, I expect a bearish reversal to commence soon.
The big picture
Overall, I am leaning towards the bears pushing the value of the greenback to the range between 1.3196 and 1.3249. This is driven by the fact that the technicals support a descent in the currency’s value till that point. However, whichever way you do decide to trade, do ensure that you utilize trailing stops, as this shall aid in capital preservation.
Good luck trading.
Disclosure: I/we have no positions in any stocks mentioned, and no plans to initiate any positions within the next 72 hours. I wrote this article myself, and it expresses my own opinions. I am not receiving compensation for it (other than from Seeking Alpha). I have no business relationship with any company whose stock is mentioned in this article.
Be the first to comment