CRUDE OIL & GOLD TALKING POINTS:
- Crude oil price chart hints at rebound before G20 summit
- Gold prices at risk if US/China de-escalation boosts yields
- OPEC+ output cuts may be offset by US production swell
Crude oil prices rose following Reuters reports suggesting Russia is becoming convinced of the need to join another OPEC-led coordinated output cut effort. The news agency cited unnamed sources as saying that Moscow a deal may be unveiled at the cartel’s meeting held December 6-7 but negotiation cartel leader Saudi Arabia is still on-going. Gold prices edged narrowly higher, building on Wednesday’s potent climb.
G20 SUMMIT IN FOCUS, EIA OUTPUT DATA DUE
Looking ahead, EIA monthly output data may cap near-term crude gains if it underscores that OPEC+ output reduction efforts will face a potent counterweight in swelling US production. News-flow from the G20 summit in Argentina might dominate the spotlight however as the participating country’s leaders – including the heads of China, Russia and the US – join the proceedings.
The ongoing US trade war with China is likely to take top billing. If a meeting between presidents Donald Trump and Xi Jingping projects a conciliatory tone and stokes hopes for de-escalation, a pickup in risk appetite may pull cycle-sensitive crude prices higher alongside stocks. A parallel rise in yields may bodes ill for gold however. An acrimonious outing might lead in the opposite direction.
See our guide to learn about the long-term forces driving crude oil prices!
GOLD TECHNICAL ANALYSIS
Gold prices remain mired in a narrowing congestion range. A daily close above trend line resistance at 1225.24 sees the next upside barrier in the 1235.24-41.64 area. Alternatively, a move below upward-sloping support at 1203.98 sets the stage for a retest of the 1180.86-87.83 range floor.
CRUDE OIL TECHNICAL ANALYSIS
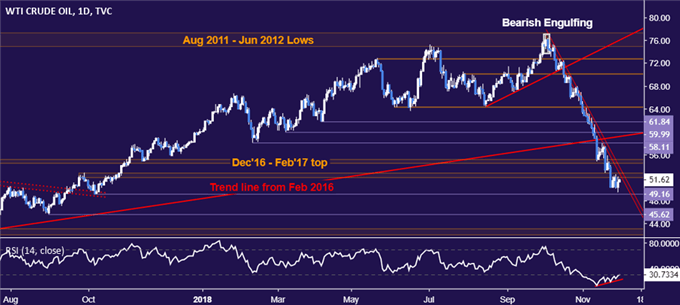
Crude oil prices are still stuck below resistance in the 52.10-83 area but positive RSI divergence hints a rebound may be brewing. A daily close above this barrier opens the door for a test of the 54.48-55.21 zone. Alternatively, a move below the October 2017 lowat 49.16 exposes the August 31 2017 bottom at 45.62.

COMMODITY TRADING RESOURCES
— Written by Ilya Spivak, Currency Strategist for DailyFX.com
To contact Ilya, use the comments section below or @IlyaSpivak on Twitter
Be the first to comment