
In a recent article, Brad Thomas suggests that STAG Industrial (STAG) is not only a SWAN, but is also “Best-In-Class”. Reaching that conclusion seems to require an investor to ignore most of the class. Since STAG’s IPO, industrial REITs have been a very strong class and have produced returns well in excess of other REIT categories.
As I have argued in the past, there are certainly times where STAG is the best trade. And it has certainly had some runs where it has provided fantastic returns. Over it’s short history, STAG has generally outperformed indexes. At most points, buying STAG has not been a “bad” decision in that it provided a return that most investors would be happy with. However, the same thing could be said about pretty much any other industrial REIT since 2011.
The phrase “Best-In-Class” does not suggest that a particular company performs better than average in the market. It suggests that a particular company is better than their most immediate peers. In STAG’s case, that would be other industrial REITs.
If someone asks me which industrial REIT is a SWAN, only one name comes to mind, Prologis (PLD). Note that my answer is different than if someone asked me “which industrial REIT has the greatest upside?” Where my answer would be Terreno (TRNO). While TRNO is my largest industrial REIT position, it is not one I would classify as a SWAN because with that great upside comes more volatility and risk.
For the purposes of this article, I will compare STAG directly with PLD- the largest industrial REIT and Eastgroup Properties (EGP), a REIT I consider comparable to STAG in terms of target markets. I will extract the positives for STAG that Brad points out and do a direct comparison with these two peers.
When STAG is directly compared to their peers, how do they stack up? For easier comparison, I created the following scorecard, with each category using a category that was mentioned as a positive for STAG in Brad’s article.
In the conclusion, I will fill in 1st, 2nd and 3rd place in each category. I tried to focus on points which can be compared using data provided through SEC filings and official supplements rather than projections or opinions that might be subject to biases.
History
If one were to create a list of what STAG has done right, the timing of their IPO would have to be near the top. They raised capital and bought when the secondary markets they choose to focus on were still heavily depressed by the recession. While many larger markets had started recovery, STAG management correctly identified that the recovery had not started in many smaller markets and that it was only a matter of time before the recovery spread to those markets.
STAG hit the ground running, issuing significant equity and raising as much money as they could to aggressively buy properties in depressed markets. In short, they followed the most basic investment rule “buy low”.
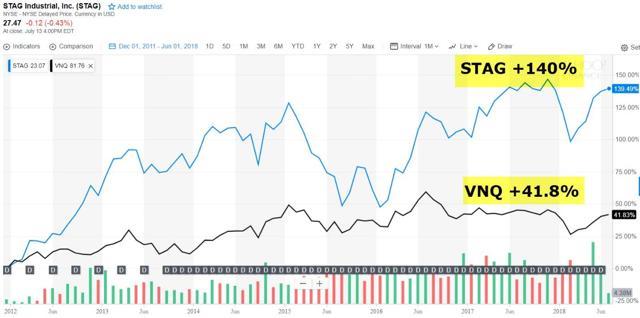
In his article, Brad compares STAG to VNQ since the date of his first article. (November 11, 2011)
 (Source)
When you compare STAG to their peers, things are a little different.
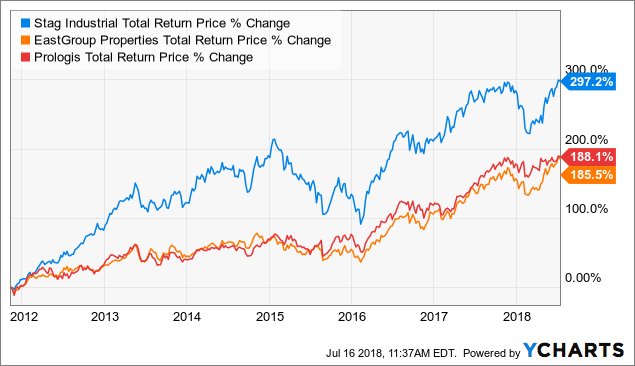 STAG Total Return Price data by YCharts
I used “total return price” in order to accurately represent the advantage of STAG’s higher dividends. November 2011 was an excellent time to buy STAG. Comparing to EGP and PLD, STAG has produced a much higher return.
In November 2011, STAG was trading at all time lows, 15-20% off of their IPO price. In my opinion, it is a little misleading to compare a company that is 6-months from their IPO to companies that have been established for years. Variations the first year after IPO tend to be more dramatic than mature companies and that period can heavily impact price comparisons for years.
For example, look at a comparison from November 11, 2012, to present:
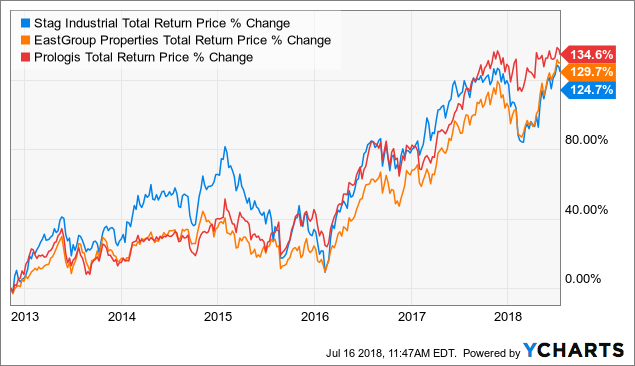 STAG Total Return Price data by YCharts
Moving 1-year forward, we can see that STAG’s return is much more comparable to peers. Going from a completely dominating lead in total return, to being 10% below PLD and 5% below EGP.
In fact, if we look at periods for EGP and PLD where they had their lows after IPO, they experienced similarly large returns over the following 7 years.
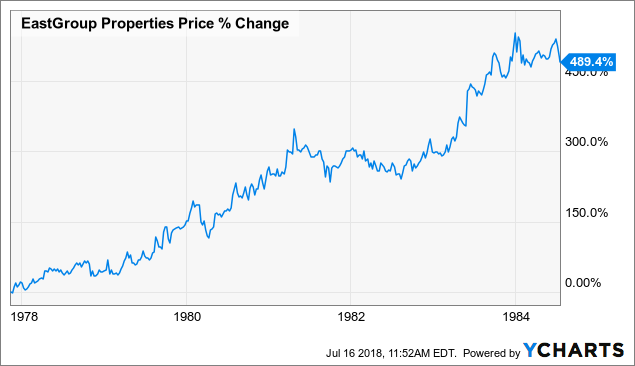 EGP data by YCharts
 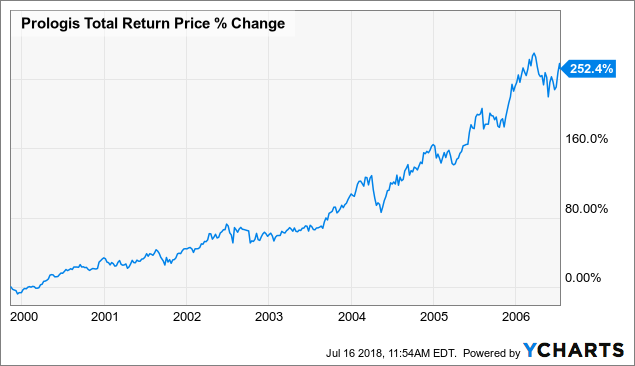 PLD Total Return Price data by YCharts
Are these returns indicative of what the companies are capable of returning on an ongoing basis? Of course not. It is indicative that after IPO, it took the market time to determine the appropriate valuations.
When comparing historical results, it is important to consider the time-frame of the comparison and consider whether there were any one-time events that create an unusual impact on price. I would suggest that the year or two immediately following IPO is not an accurate reflection of typical trading for a company.
I did not include historical performance as a category because it is subjective. Simply choosing the starting and stopping points can introduce a series of biases and is not necessarily an apple to apple comparison. Remember, the question is which REIT is a SWAN and best-in-class, not which REIT had the greatest price increase over a certain period.
Geographical Diversification
The next positive Brad points to is diversification. Diversification falls into two types, geographic diversification, and tenant diversification.
With 360 buildings in 37 states, STAG has significant geographical diversification. PLD has a much greater reach with their international exposure.
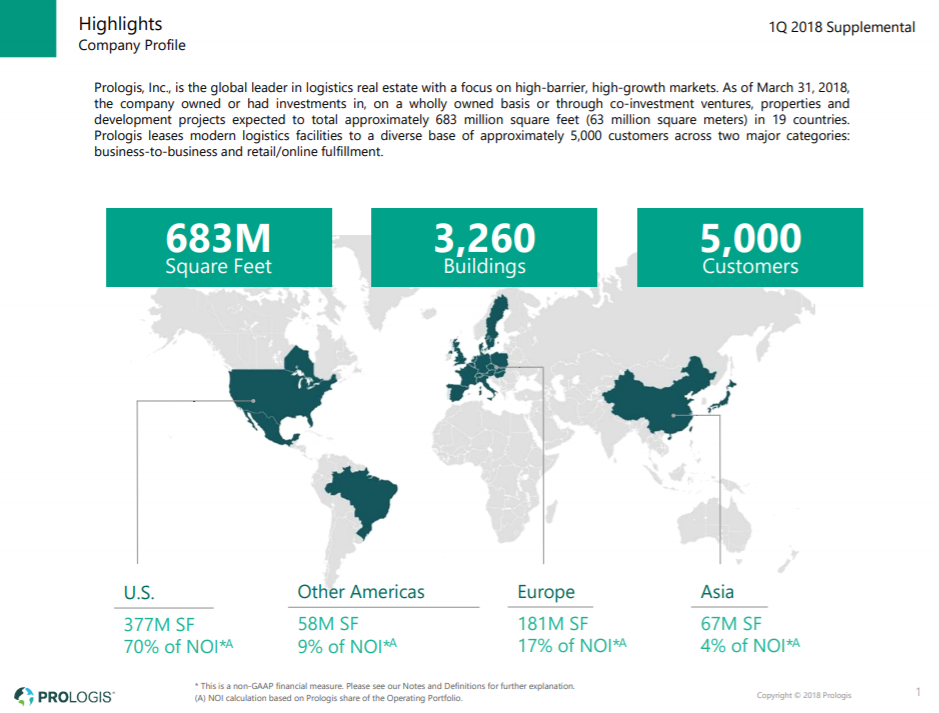
Spread across 4 continents and 19 countries, PLD provides a diversification that is unmatched by peers. Interestingly, within the US, PLD is less diversified that STAG. Stag’s top 20 markets only account for 65% of their base rent. In contrast, PLD’s top 10 US markets account for 55% of their total NOI and 79% of their US NOI. In this category, I would suggest they are tied with the main difference being whether you want diversification inside the US or across the world. Something I consider a personal portfolio level decision.
Compared to EGP, STAG clearly has greater geographic diversification. 19 markets in 6 states account for 93.5% of EGP’s base rent. EGP is not a REIT for those looking for geographic diversification.
Tenant Diversification
In terms of tenant diversification, STAG’s largest tenant accounts for 2.5% of revenue and their top 10 accounts for 13.7% of revenue. How does this compare to their peers?
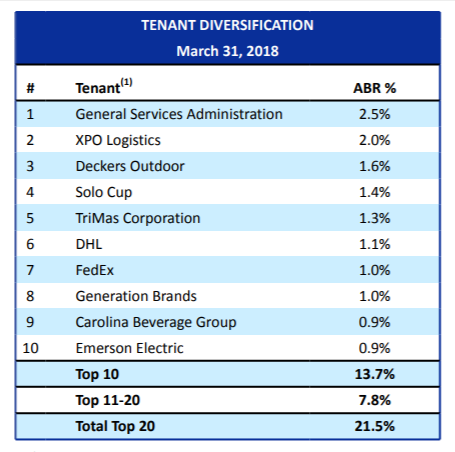
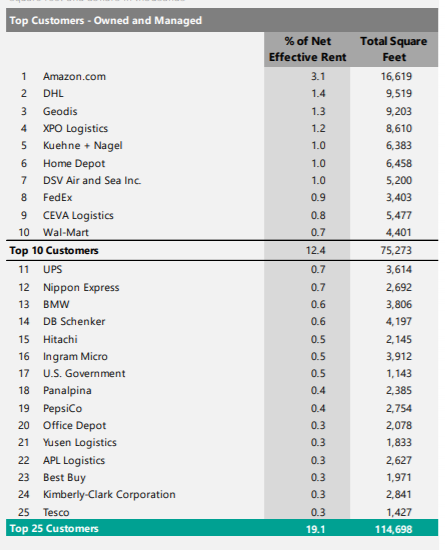
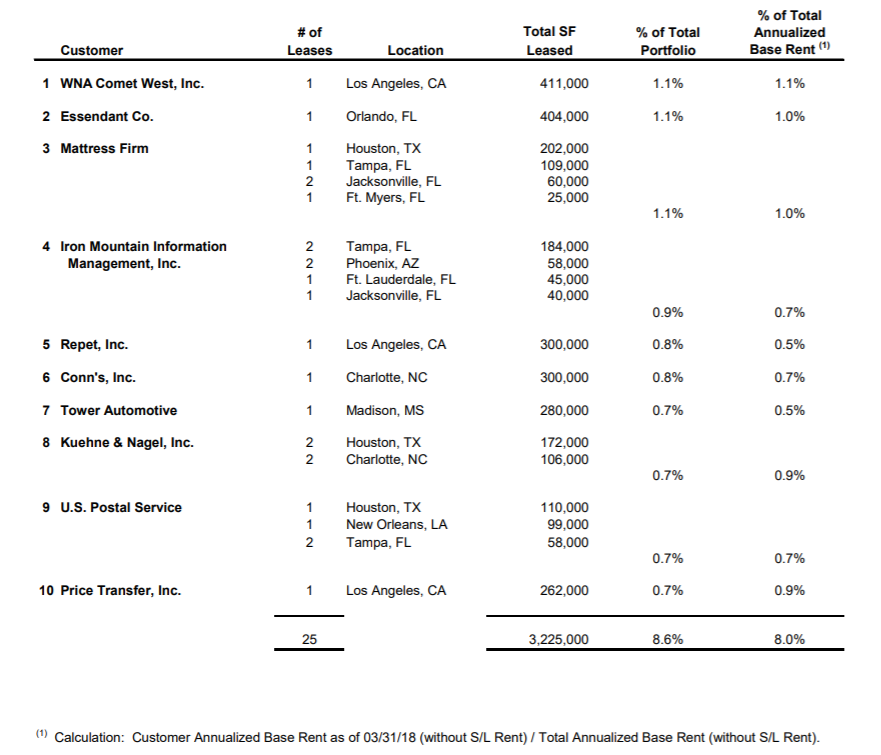
PLD’s top tenant is Amazon (AMZN) and at 3.1% of rent, it is greater than STAG’s top tenant, the General Services Administration. However, PLD’s top 10 are more diversified than STAG’s top 10. PLD’s top 25 accounts for a smaller portion of rent than STAG’s top 20.
EGP only provides information on their top 10, and at 8% of base rent, they have less exposure to their top 10 tenants than STAG or PLD.
EGP clearly has the most diversification, while STAG is the least diversified.
Cost of Capital
In his article, Brad says,
STAG’s balance sheet continues to be very strong, as evidenced by a BBB rating, which was affirmed by Fitch in March. The company has not issued common equity this year, and leverage was 5.1x on a net debt-to-run rate EBITDA basis at quarter end.
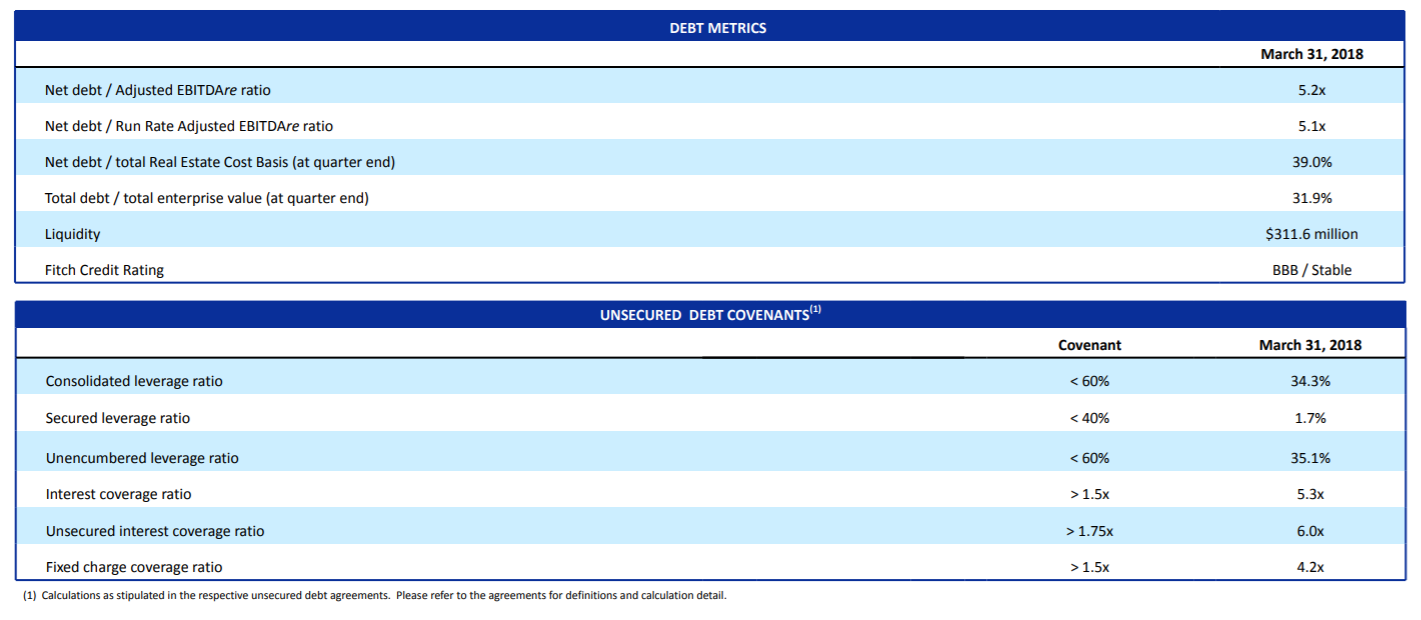
Not bad, but how does that stack up to peers?
Brad notes in his article that PLD has a superior cost of capital. Here is a look at PLD’s debt metrics,
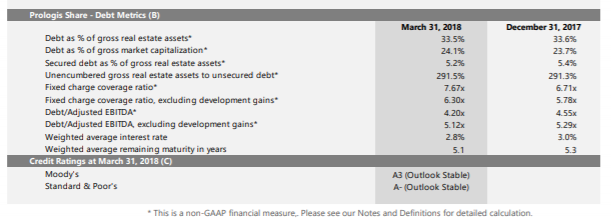
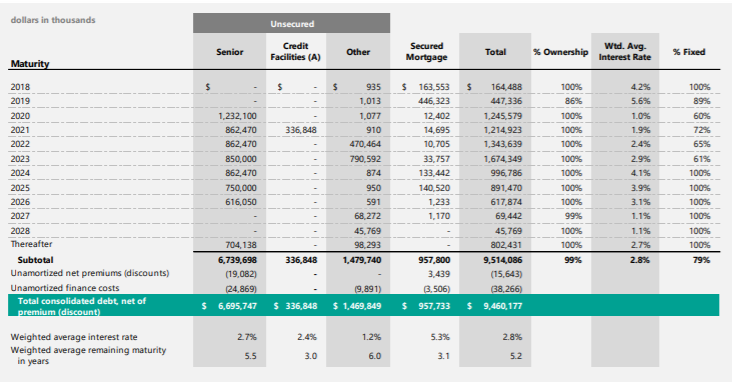
With an A-rated balance sheet, PLD crushes their peers. Their advantage in size and their conservative balance sheet shows on the bottom line. Where STAG’s average interest rate is 3.56%, PLD’s is 2.7%. With $458 million in cash and over $3.2 billion available under existing credit facilities as of the latest 10-Q, PLD has numerous options to access capital. In this area, it cannot be disputed that PLD is far more attractive than STAG.
Taking a look at EGP’s supplement,
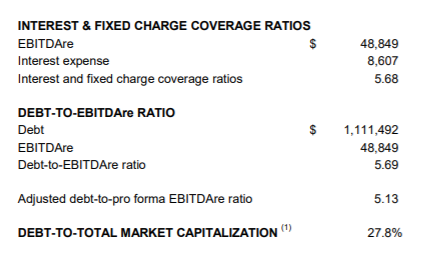
EGP is much closer to STAG. With a Baa2 credit rating from Moody’s, the balance sheets are much more similar. Like STAG, EGP has a debt/EBITDAre ratio that ranges from 5.0-6.0x. EGP has a better fixed charge coverage ratio and slightly lower debt to market cap.
EGP’s weighted average interest rate is slightly higher than STAG’s at 3.73%. That gap should close when EGP pays off the $50 million 7.5% mortgage that matures in 2019.
The biggest differences between EGP and STAG in terms of cost of capital is that EGP’s equity can be issued at much higher prices than STAG’s. So while their debt costs are close to equal, EGP easily pulls ahead with a lower cost of equity.
Retention
In regards to management, Brad points towards STAG’s retention as a positive saying,
STAG operates a comprehensive operating platform capable of addressing every physical aspect and tenant scenario related to industrial real estate ownership. The latest retention results validate that STAG is consistently outperforming.
STAG reported 83% retention for Q1, which is well above their long-term average. For the year, STAG is guiding for retention in the 75-80% range.
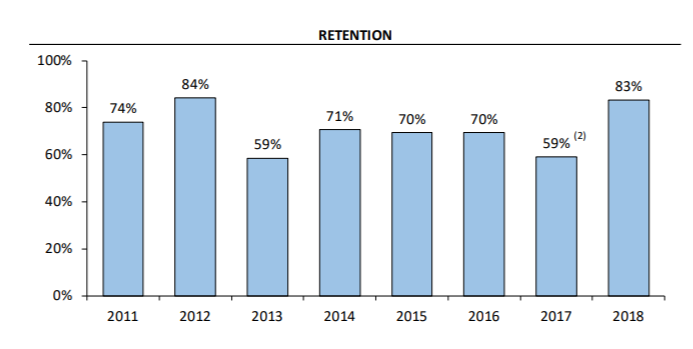
As you can see, Q1 of 2018 is clearly the exception for STAG. With the high end of guidance at 80% for the year, STAG is clearly anticipating lower retention in the remaining 3-quarters.
How does this stack up to peers?
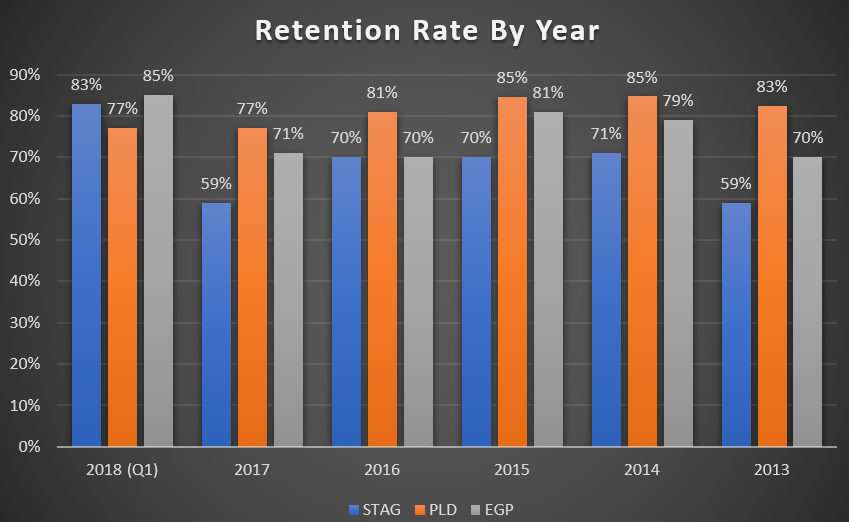 Source: Company Supplementals, Chart Authors
Looking back at the last 5-years, STAG had the lowest annual retention rate of the three companies every single year. Some might hope that Q1 for STAG is indicating a “new normal”, but even if they hit the high end of guidance at 80%, that is not something that makes them stand out from their peers.
FFO Growth
Cash flow growth is certainly one of the most important statistics when evaluating a REIT. After all, growing cash flow is what pushes dividend safety and dividend growth.
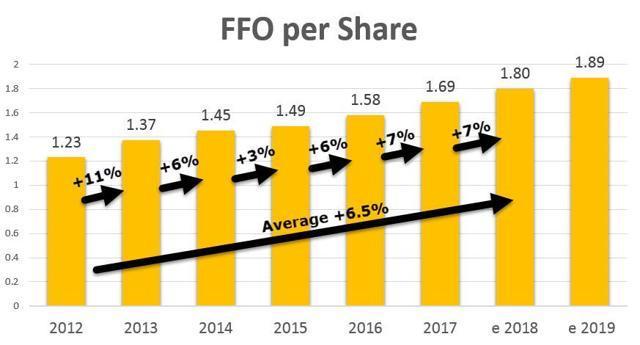
Brad uses the slide above to demonstrate STAG’s FFO growth. On its own, it looks pretty good, there is nothing wrong with routinely putting up 5-6% growth. How does this compare to peers?
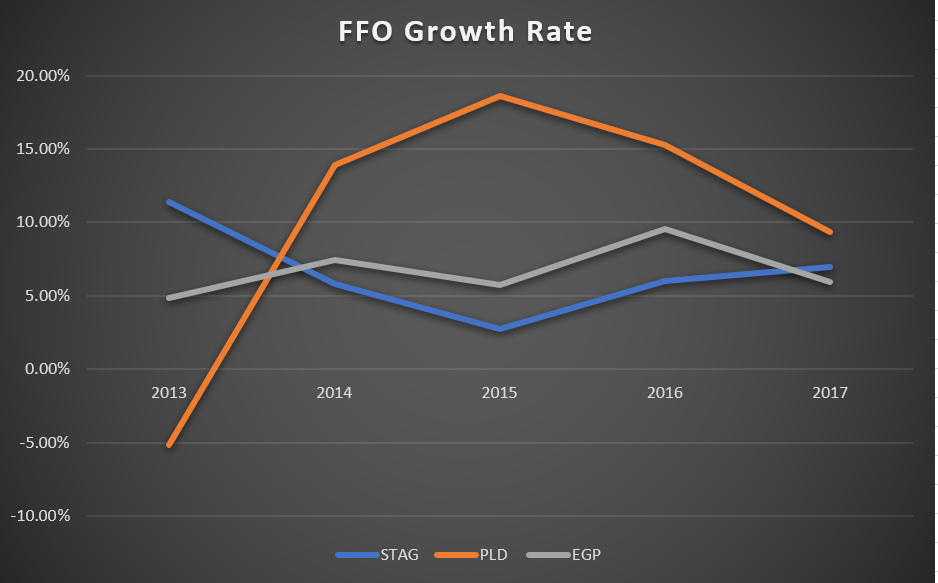 Source: Data from SEC filings, table authors.
PLD starts in the hole with 2013 FFO 5% below 2012. That deficit was quickly made up as PLD posted multiple years of double-digit FFO growth to average 10.39% annual growth over the period.
EGP held its own, having FFO growth rates in the 5-9% range. Over the entire period, it slightly beat STAG with an average FFO growth rate of 6.71% compared to STAG’s 6.60%.
The Dividend
The dividend is certainly one of the things that STAG bulls tout as a strength. STAG’s dividend yield is substantially higher than peers. Brad Thomas points to the improving FFO payout ratio. An improving payout ratio is certainly a positive in that it demonstrates more security. Using Brad’s own graph, we can see that STAG’s payout ratio still has a long way to go to compete with peers.
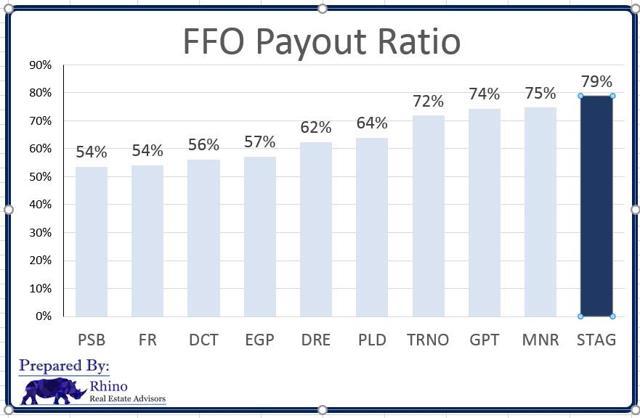
Using a much larger group of peers than I am using today, STAG is still last on the list.
While PLD and EGP start with much lower yields, they have had greater growth rates.
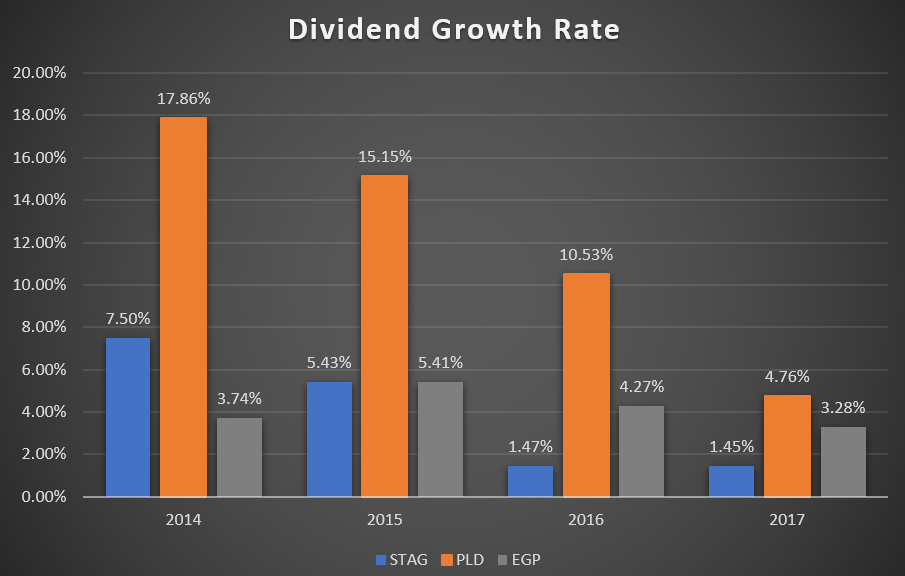 For 2018, STAG is not raising for the 3rd quarter dividends as they have in the past, so it is likely that the annual dividend will be $1.42 for another 1.4% increase. PLD has raised their dividend in Q1, if they do not change the dividend again the increase will be 9%.
EGP traditionally announces their annual dividend increase for the September payment. At the current rate, their 2018 increase will be 1.6%, but with their payout ratio so low I fully expect an increase of at least $0.02/quarter. An increase of 3.1%.
In terms of dividend safety and growth, STAG is in last place.
Conclusion
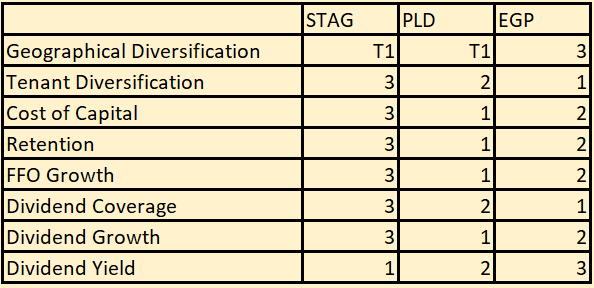 Filling in the final scorecard, STAG is only first in two categories: Geographical Diversification and Dividend Yield. PLD dominates with a cost of capital that is substantially better, a retention rate that is routinely above 80%, a 5-year FFO growth rate that is 57% higher than STAG’s, and a dividend growth rate that leaves the competition in the dust.
EGP wins in Tenant Diversification and Dividend Coverage. In several other categories, they were very close with STAG, only slightly edging them out in FFO Growth and Cost of Capital. It is easy to see how some strong years from STAG and/or some slow years from EGP would cause them to switch positions.
Is STAG “Best-In-Class”? Clearly not. PLD far outstrips them in nearly every fundamental metric and has the additional advantage of size. We can argue about whether or not STAG is a SWAN since the label is entirely arbitrary, but how can they be Best-In-Class when they fall short of their peers on nearly every metric that can be objectively measured?
Disclosure: I am/we are long PLD, TRNO.
I wrote this article myself, and it expresses my own opinions. I am not receiving compensation for it (other than from Seeking Alpha). I have no business relationship with any company whose stock is mentioned in this article.
Be the first to comment