Ethereum-USD (ETH-USD) by far is the most popular and widely used blockchain protocol in the world. It is an open-source public platform and operating system that allows everyone to create their own blockchain-based projects. In this article, I will discuss how, even after the recent market crash, ETH and other ERC-20 altcoins are still overpriced.
Let’s pretend there are two companies, Company A and Company B and both of them use a technology developed by Company E. They use Company E’s technology to develop their own products and also to process payments. If Company E were an ordinary private company, it would be reasonable to say the following about Company E’s fair value:
- It would depend on the level of the commission Company E would take for transaction processing.
- It would be capped by the combined fair market value of Companies A and B.
The same logic can be applied to the valuation of ETH, with only a key difference: There are many more companies and shareholders that are substituted by miners. While the level of commissions the Etherium network charges for transaction processing is a very volatile and unpredictable parameter, I decided to focus on the calculation of the fair market value of the companies that use the Etherium network.
To conduct the valuation, I have made several assumptions. First, Etherium is an asset backed by other Altcoins. As I have already pointed out, Etherium is an operating system and platform that allows other companies to develop new products on or to transfer current operations and business processes into the blockchain system.
Technically, the Etherium Foundation is a non-profit organization and its main asset is the amount of Etherium it holds on its account. But, theoretically, it’s plausible to assume that the company’s enterprise value depends on the number of projects that use Etherium blockchain and on the volume of transactions going through these companies. So the logic here is pretty simple: The more people who use Etherium-based projects, the move valuable the Etherium network becomes.
According to coinmarketcap, there are 1568 tokens that have been issued and are traded on different crypto-exchanges, and approximately 510 of them are ERC20-based tokens. These tokens represent around 91% of all market capitalization of all tokens (excluding independent none-ERC20 blockchains like Bitcoin, Litecoin, Ripple, etc.).
Market Share of Etherium-Based Projects
Source: medium.com
My second assumption is that most ICO companies issue security tokens. The reasoning for this assumption is pretty simple. There are three ways you can classify tokens: A token can be classified as an asset (like gold, silver, and other metals), as a means of value transfer (aka currency), and as a security token.
Here is the logic I applied: There are basically three coins that are used as a mean of payment, Bitcoin, Bitcoin Cash, and Monero. At least 90% of all goods are priced in one of these cryptos, especially in a darknet. As soon as none of these currencies are ERC20-based, all 510 ERC20 tokens should be classified either as assets or as equity-like tokens. Without going too deep into the details, I should say that based on what I have seen and what I know about this market in terms of economic essence there is little, if any, difference between these two categories. Therefore, I classified all 510 tokens as security tokens.
Valuation of the Fair Market Price of the Market and ETH
In most cases, the price of the token is determined by hype, white paper quality, and token sales techniques. While this information is essential for the understanding of a project, it does not provide you with any fundamental hints that can be used to determine the fair market value. While it’s difficult to determine the fair market value of any particular token, it’s possible to determine the intrinsic value of the whole ERC20 crypto market. And then you can use this estimation to figure out how ETH should be priced.
CB Insights tracked the development of 1,098 startups that raised seed investments in 2008-10 and built a funnel that shows survival rates, statistics of follow-on round investments, and M&A activity for startups in each investment round. We can apply this funnel to ICO companies in order to see how many companies would end up in each category if they raised investments through classical VC financing.
Startups Failure and Success Rates
Here’s a look at the failure and success rates, according to CB Insights:
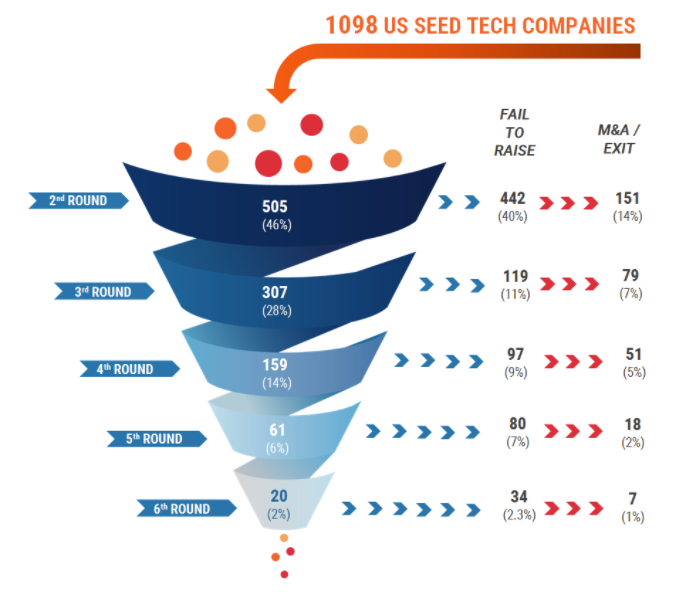
Source: “CB Insights: Venture Capital Funnel Shows Odds Of Becoming A Unicorn Are Less Than 1%“
By doing this, we assume that out of 510 ERC20-based projects all are deemed to be seed stage companies, which is a plausible assumption since (according to a Mangrove Capital Partners report) more than 80% of all companies that conducted ICO had nothing but white papers at the moment of ICO.
Timing of ICOs

Source: Mangrove Capital Partners
Using this information, we can easily calculate what the future distribution of ICO companies among different investment rounds can be.
| Round # | Round Name | Share | # Of Companies | # Of Companies Ended Up In Each Round |
| 1 | Seed | 100% | 510 | 275 |
| 2 | A | 46% | 235 | 92 |
| 3 | B | 28% | 143 | 71 |
| 4 | C | 14% | 71 | 41 |
| 5 | D+ | 6% | 31 | 31 |
| Total | – | – | – | 510 |
Source: Author calculations
According to the CB Insights’ funnel:
- 275 projects have raised only seed investments and will not be able to raise follow-on investments
- 92 projects will raise follow-on Round A investments
- 71 projects will raise follow-on Round A investments and later on raise additional Round C investments
- 41 projects will raise three additional investment Rounds: A, B and C
- 31 projects will go up to Round D
It’s worth mentioning that, according to CB Insights, almost 70% of all companies eventually go bankrupt. And as has been reported by Fortune nearly 60% of all ICO companies have already failed to survive.
Now, when we have the approximate distribution of companies by investment rounds, we need to find average post-money valuations of companies by each category. Using the Pitchbook 2016 report, we can see the following post-money valuations for each investment round:
- Seed Round: USD 8 mln
- Round A: USD 21 mln
- Round B: USD 51 mln
- Round C: USD 100 mln
- Round D+: USD 193 mln
Average Post-Money Valuations on Different Fundraising Rounds
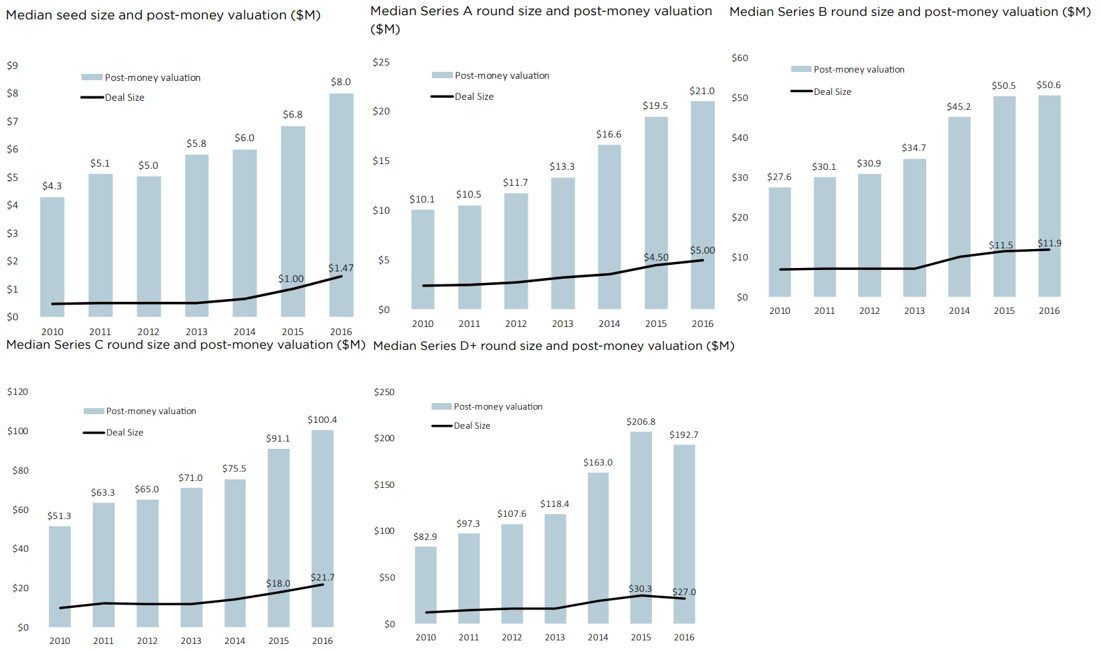
Source: Pitchbook, VC Valuation Report, 2016
Using this data, one can easily determine what an approximate valuation of these companies may be (see chart below).
| Round Name | # Of Companies In Each Round | Medium-Post Money Valuation (mln USD) | Total Post-Money Valuation (mln USD) |
| Seed | 275 | 8 | 2 203 |
| A | 92 | 21 | 1 928 |
| B | 71 | 50,6 | 3 613 |
| C | 41 | 100,4 | 4 096 |
| D+ | 31 | 192,7 | 5 897 |
| – | 510 | – | 17 737 |
Source: Author data
The estimated future fair value of all ERC20-based ICO companies equals USD 17.7 bln. Putting it into perspective, the current market capitalization of these projects is USD 36 bln. Therefore, in the future, market capitalization of ERC20-based projects can plummet by around 49%, which could consequently lead to a proportional decline in the price of ETH.
Disclosure: I/we have no positions in any stocks mentioned, and no plans to initiate any positions within the next 72 hours.
I wrote this article myself, and it expresses my own opinions. I am not receiving compensation for it (other than from Seeking Alpha). I have no business relationship with any company whose stock is mentioned in this article.
Be the first to comment