“Patience is not just about waiting for something … it’s about how you wait, or your attitude while waiting.” — Joyce Meyer
The message here in the last few years has been all about trend. What we just witnessed when stocks fell was all about a countertrend. That got some people very upset. And it shows how short sighted thinking can take over in times of stress. Many immediately conclude that this quick countertrend will now become the new trend.
That’s not looking at all of the facts. Applying simplicity and common sense to the issue is a far better way to proceed. Doing otherwise is what gets most investors in trouble. Helped with headlines that are everywhere in our world fed by social media outlets, they conjure up premature conclusions that are arrived at overnight. Someone steps out of the shadows and declares what investors fear the most, these issues are real. Of course they are real! THE question is how much of a threat do they hold for us now.
A contingent of investors steps up and does the wrong thing at the wrong time, every time. They act before they think. A second wave of people just sit back and assess the situation and take no immediate action. Who do you think is successful over time?
We criticize the computer trading programs because they pick up on a key word or phrase in a headline, then use it to make buy and sell decisions based on no evidence at all, sending indices up or down in a matter of minutes. It turns out investors do this all of the time, and have been involved in this type of emotional decision making for decades now. They designed these trading programs to overreact.

Ladies and gentlemen, despite what anyone wants to tell us, trends that have been established do not change overnight, it is a process. Might this recent correction event be the start of that process? No one knows for sure. What we do know is that similar instances have occurred during this current bull market, yet the true trend has resumed.
Remember early 2016 and the correction to start the year? So far, it looks like the time period may have changed, but the same mistake may have been made again. Everyone likes to be first, some enjoy being a trailblazer. Follow the automated trading programs. Get out before the stampede begins and buries those fools that are sitting around and assessing the situation. Sounds reasonable, but it backfires more times than not. Anyone that left the primary trend because they believed it was the start of a change, is now left behind. They left 52% of stock market gains on the table.

The fools remembered that earnings are improving, companies are raising guidance at a very fast clip and many of those CEO’s did a lot of talking about that less than 2 weeks ago. Amazing how that is now lost in the headline du jour regarding inflation. While these market participants were fiddling around they also noticed that the global economic backdrop continued on its strong recovery pace.
There are no set rules for corrections, no textbook version of what has to happen. We have seen all sorts of variations in the course of stock market history. There are many possibilities in varying time frames before a true trading bottom is put in.
Overreacting, jumping to conclusions, just because it seems to be the thing to do at the moment, rarely pays off. In fact it usually wins up costing investors a lot more than they are willing to admit. It’s not just that one knee jerk moment that comes into play, it’s the what do I do next that can be the larger issue. A quandary for anyone that sold at the lows seen during the Feb. 9th drop. Simply go and ask how much emotional turmoil the folks that bailed out in February of 2016 have been through since.

Economy
Scott Grannis lays out a great picture of what investors need to be concerned about, and what is noise when it comes to the economy.
Q1 GDP estimates from the Atlanta Fed GDPNow models down from 4% to 3.2%. So much for getting excited about their 5+% GDP forecast a couple of weeks ago.
The Flash U.S. Composite Output Index rolled in at 55.9 (53.8 in January). A 27-month high. The Manufacturing component rose 0.4 points to 55.9 in the flash February print. That’s a 40-month high. Services Business Activity component was reported at 55.9 (53.3 in January). A 6-month high.
Chris Williamson, Chief Business Economist at IHS Markit:
Business activity growth accelerated markedly in February, suggesting the economy is growing at its fastest pace for over two years. The upbeat February PMI surveys are indicative of GDP rising at an annualized rate of 3.0%. Even faster growth is signaled for coming months. February saw the largest influx of new orders for almost three years, while business expectations about the year ahead jumped to the highest since May 2015.
Leading Economic Indicators were up 1% to 108.1 in January, a new record high.
Ask yourself, shouldn’t interest rates be rising with this backdrop? So this obsession as rates go from 2.87 to 2.95 sending stocks down, then from 2.95 back to 2.87 sending stocks back up, is really overdone.

The last time jobless claims were below 230K for three straight weeks was in March 1973, just a month short of 45 years ago.

As per Bespoke Investment Group:
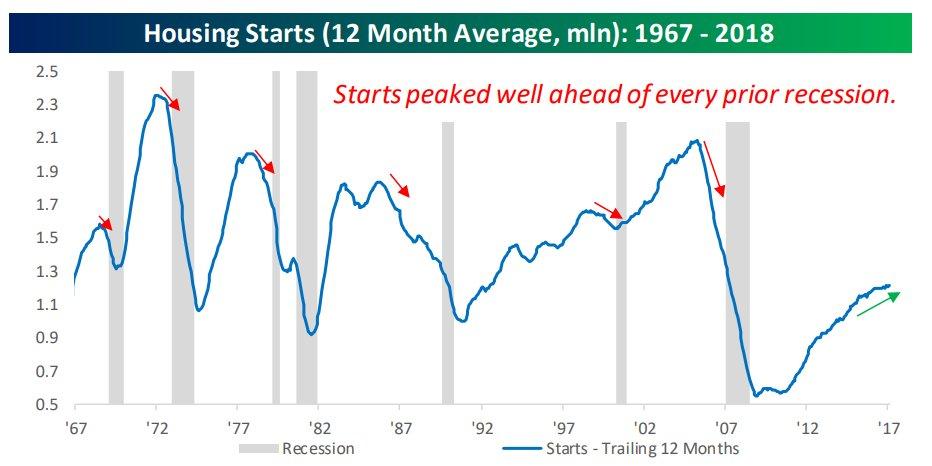
The continued strength in Housing Starts suggests that the economic expansion continues to chug along. Every prior recession in the last 50+ years has been preceded by a rollover in Housing Starts, and in most cases the peak in starts came well ahead of the peak in the economy. With Housing Starts and Building Permits both hitting cycle highs on a 12-month average basis in January, it suggests that any economic downturn is a ways off.
Existing Home Sales down 3.2% in January. Inventory remains the issue, supply is down to 3 months.
As per Lawrence Yun, NAR chief economist:
January’s retreat in closings highlights the housing market’s glaring inventory shortage to start 2018. The utter lack of sufficient housing supply and its influence on higher home prices muted overall sales activity in much of the U.S. last month. While the good news is that Realtors® in most areas are saying buyer traffic is even stronger than the beginning of last year, sales failed to follow course and far lagged last January’s pace. It’s very clear that too many markets right now are becoming less affordable and desperately need more new listings to calm the speedy price growth.

Global Economy

Eurozone Composite PMI remains elevated, sitting just below 12-year highs.
As per Chris Williamson, Chief Business Economist at IHS Markit:
February saw the eurozone’s growth spurt lose a little momentum, but the rate of expansion remains impressive, putting the region on course for its best quarter for almost 12 years. The PMI readings for the first two months of the quarter generally provide a reliable guide to official GDP growth, and indicate that the eurozone economy is expanding at a quarterly rate of 0.9% in the opening quarter of 2018.
Germany’s economy grew by 0.6 percent in the final quarter of last year. For the whole year, the economy expanded by 2.2 percent, marking the largest annual growth since 2011.

Japan manufacturing eased to a reading of 54 from the January report of 54.8. Joe Hayes, Economist at IHS Markit, which compiles the survey:
February Japan flash PMI data is a fairly mixed bag overall. On the one hand, output and new business inflows increased to weaker extents, while recent yen appreciation has coincided with slower new export order growth. Furthermore, a number of panelists indicated that the stronger currency had prompted them to lower prices to overseas customers. Indeed, further yen strengthening will create unwanted drag on inflationary pressures.

The U.K. requested that a transition deal last “as long as it’s needed,” a big shift away from the hard line position of “get out as quickly as possible no matter the cost.” While a period of “around 2 years” is still what the UK claims to want, removing the fixed date which had previously been in place (Dec. 31st, 2020) for the end of the transition period theoretically does a lot to improve the design of post-exit arrangements and to smooth the departure of the UK.
Many reports now indicate that it’s easy to envision 2 years turning into 5, and then 10, as the hardest decisions and most complex subjects are forever punted down the road. Maybe it’s time to move this issue from This will upset the global economy for years to come category to This may not happen for years list.

Earnings Observations
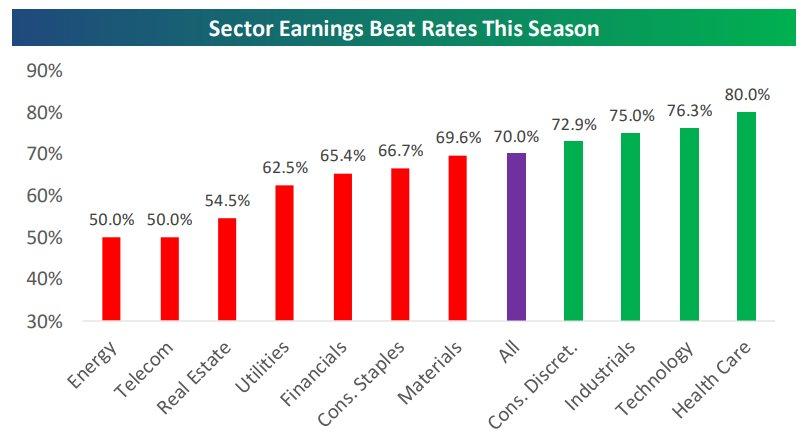
Healthcare and Technology lead the pack as far as beating earnings estimates. One reason I continue to like those sectors as the year marshes on.
Source: Bespoke
As per Factset Research‘s weekly update:
• Earnings Scorecard: For Q4 2017 with 90% of the companies in the S&P 500 reporting actual results for the quarter, 74% of S&P 500 companies have reported positive EPS surprises and 78% have reported positive sales surprises.
• Earnings Growth: For Q4 2017, the blended earnings growth rate for the S&P 500 is 14.8%.
The forward 12-month P/E ratio for the S&P 500 is 16.9. This P/E ratio is slightly above the 5 year average (16.0) and above the 10 year average (14.3). In this interest rate environment, overall market valuation should be of no concern to investors.
Here are some interesting data points about this earnings season:
-
Since 1998, there have only been four other quarters with a higher earnings beat rate, and the last was more than ten years ago in Q3 ’06.
-
So far, this is the highest pace of revenue beats since Q4 ’04 and the fourth highest rate since 1998.
- If 14.8% is the final growth number for the quarter, it will mark the highest earnings growth since Q3 2011 (16.8%).

The Fed, Interest rates, and Inflation
The FOMC minutes were released this week, and the initial reaction interpreted them as being dovish. Fed officials seemed more upbeat than in December, showing underlying momentum in the economy modestly stronger. The Fed believes the strengthening near-term economic outlook increases the likelihood that a “further” gradual upward trajectory of fed funds rate would be appropriate. In my view there really were no surprises contained in this report.
Despite all of the talk about overheating and inflation spiking, Empirical Research notes:
We are not ready to conclude the economy is starting to overheat. Its overarching view is the recovery is not yet in the late innings. With year-over-year core prices still below 2%, inflation’s not at a point that should prompt a faster Fed. The central bank targets PCE inflation, which has been systematically lower than CPI for years and tends to move more slowly. Even if core CPI exceeds 2% by some margin, the Fed may let it run higher for some time.
I believe its a valid way to view the situation at present. Far too many take one month’s headline and run with it.
Cullen Roche reminds us that secular trends are in place, stating that the likelihood of very high inflation is low because the dominant long-term macro trends are dis-inflationary.
-
Labor class weakness, regulations, union weakness, innovative efficiencies, cheap labor alternatives and the growing power of corporate America have put tremendous downward pressure on wages.
-
Demographic trends are disinflationary. The ageing population and slowing growth in the overall population will tend to reduce aggregate demand and the potential for demand-pull inflation.
-
Technology trends are reducing the risk of cost-push inflation as the cost of production declines due to increasing efficiencies.
-
Inequality is disinflationary as it puts downward pressure on potential balance sheet expansion. Households are wealthier than ever, but median income relative to liabilities is also near record highs. This reduces the potential increase in the money supply as borrowing cannot expand substantially.
He summarizes the present situation for us nicely:
Secular macro trends are clear, the risk of high inflation is low. The short term trends are less clear, however, there does appear to be somewhat limited upside risk at present in future inflation. A rise in the Core CPI to 2.3% would not be surprising and will very likely keep pressure on the Fed to continue raising rates thru 2018. On the other hand, the secular trends remain firmly in place and will likely cap any potential rise in future inflation.

Sentiment
Corporate buybacks peaked 2 yrs ago (1Q16). According to some pundits, this was supposed to mark the top of the market, because that’s what happened in 2007.
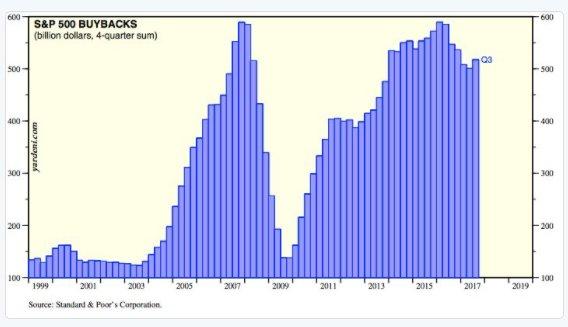
This isn’t 2007, running with one data point, change an investment strategy based on that, is tantamount to running face forward into brick wall.
AAII, bullish sentiment on the part of individual investors was little changed, dropping from 48.52% down to 44.65%, which is right in line with levels we have seen in recent weeks.

Crude Oil
Crude inventories declined after 3 straight weeks of increases. Weekly Inventories were reported showing a 1.6 million draw down this week. After the recent huge Gasoline build, this week saw a much smaller increase of 0.3 million barrels.
The price of crude rebounded this week after briefly dipping below $60 a barrel. WTI closed out the week at $63.53, up $1.94, and now may be set to challenge the top end of the trading range at $66.

The Technical Picture
The short term mindset has changed. This week saw the S&P 500 index up 1% at one point, than finished down at least 0.5%. That has happened twice this month. Last week the technical commentary put forth a neutral stance for the short term:
Next short-term resistance comes from the 20-day MA (green line) at 2,754. The index was rebuffed there in the initial attempt on Friday (Feb. 17).
The back and forth action is indicating that the S&P may be settling into a trading range now.
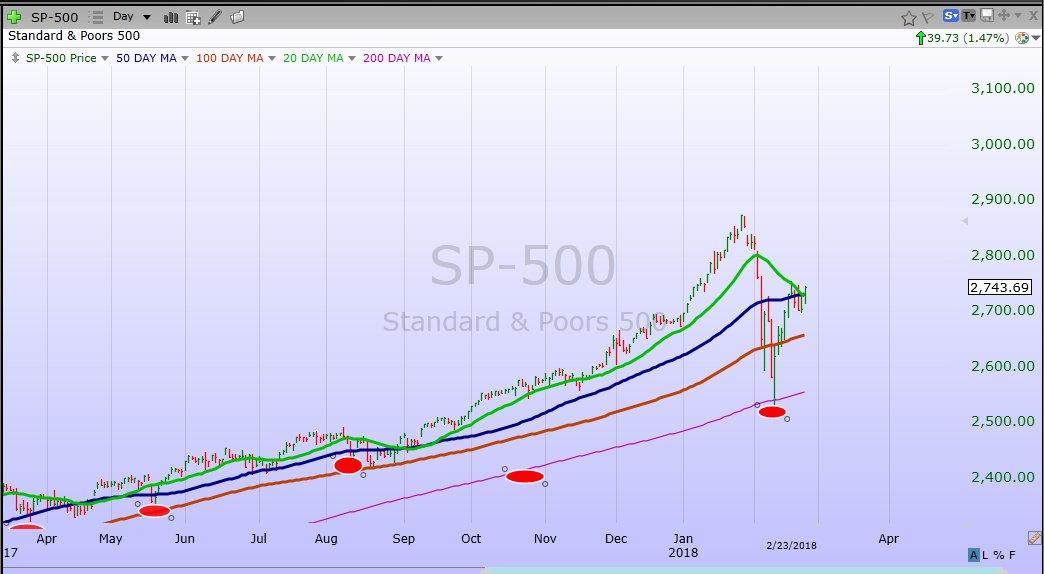
Chart courtesy of FreeStockCharts.com
The S&P failed to clear that short term resistance all week long, as rallies were sold, until Friday afternoon. Up to that point it was quite obvious how the short term traders took over, as every rally had stopped at the downward sloping (green) trend line. Perhaps the sell the rally mentality will start to fade as quickly as it appeared.
A close above that 20-day MA (2725) would be a win for the bulls. Just as I mention that no talk of a correction can start until the 20-day MA is broken to the downside, no talk of a true rebound rally can be discussed until that resistance is overtaken. No fanfare or parades for the Bulls just yet. It still appears that the index may settle into the range between the 50 (2729 /blue line) and 100 day (2655 /red line) moving averages.
Let’s see how the situation unfolds, as it has only been two weeks since the lows. The rebound pattern may now be more of the “W” variety, instead of a straight “V” move back to new highs immediately. We also need to be reminded of the real test mentioned last week. How the market reacts when it gets close to the January highs.
Short term support is at the 2656 and 2632 pivot points, with resistance at the 2674 and 2780 levels.

One notable observation. Of the major indices, the Nasdaq appears to be the strongest. It was the first to overtake and sit above all of the major moving averages that are followed.

Market Skeptics
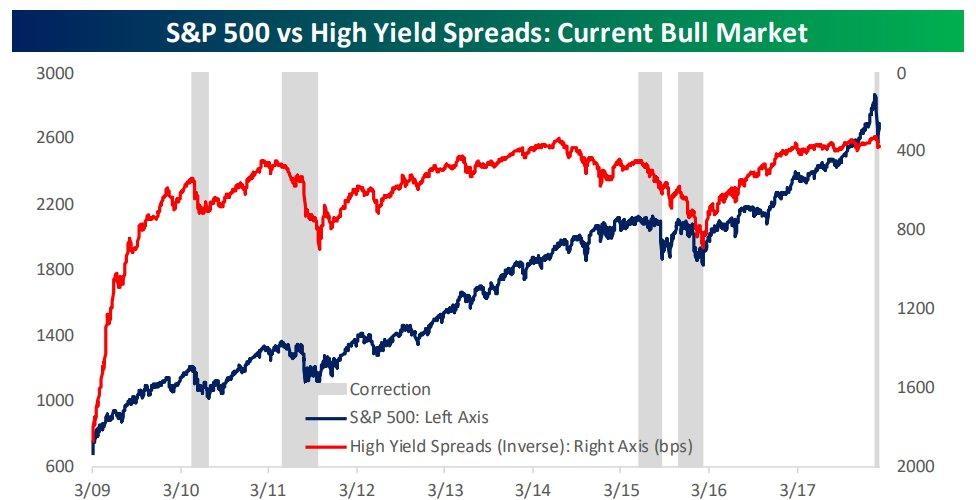
This recent correction has been somewhat different. There has been no concern shown in the credit markets. Stocks and high yield debt are generally considered to be near each other on the risk spectrum. So when equities sell off, high yield debt almost always comes under pressure as well.
Source: Bespoke
Looking at each prior correction, when the S&P 500 declined, spreads on high yield debt rose significantly. There has been no risk aversion evident in the high yield credit market that we have seen in equities in the last 2 -3 weeks. A simple run of the mill technical correction.

Individual Stocks and Sectors
The Dogs of the Dow strategy is one that has been around for quite some time. The highest dividend yield from the stocks in the Dow Jones Industrial Index after the close of business on the last trading day of the year and assembled into a portfolio. The idea is to invest equally in each stock,and hold those names for the entire year.
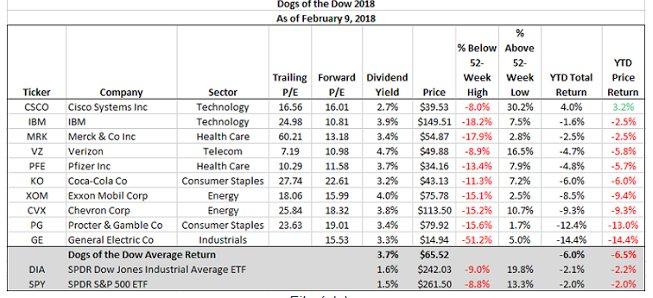
Investors continue to stay with the strong performers as they aren’t too interested in picking up what may seem as value to some. At the moment the dogs are struggling, trailing the returns of the major indices. Many of these companies are core-type holdings that will provide good income and appreciation over time.
My favorites in that list are Cisco (CSCO). A complete transformation is taking place with the company and the fundamental results support their soaring stock price. This is one stock that can hold an overweight position in a portfolio now. In addition, I believe Merck (MRK) will get the story right and reward patient investors. Solid company with a solid yield.
Dabbling in the unloved (not including Cisco here) Dow components or other out of favor sectors, like Utilities and REITS, should be done with the mindset of patience. They will eventually have their day, but it may take time. These stocks can be sprinkled in, but the lion’s share of a portfolio should be filled with ideas that are working. That strategy takes advantage of the strong bull market backdrop that is in place.
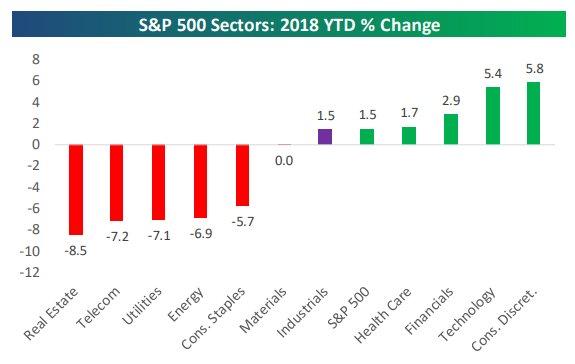
Consumer Discretionary has forged ahead of Technology during the recent period of churning. Energy joined the rate sensitive areas of the market, and is now under performing again.
Source: Bespoke

As stocks hit the recent speed bump, we all formed our opinions as to what may have caused the recent correction. More important than what caused this recent pullback, however, is what did not cause it. This is not a situation where deterioration has been seen in either the global synchronized economic expansion or in the strong corporate earnings data. Those would be developments that would cause me to be more concerned than I am currently.
-
The eurozone is no longer recovering, it is in expansion mode.
-
Global GDP growth is running well above its 10 year average.
-
Japan GDP has expanded nine straight quarters.
-
China’s economy has exhibited signs of moderating amid government efforts to reduce speculation and excess capacity.
-
India’s PMI and leading indicators are signaling upward momentum, abetted by the fastest payroll growth since May 2010.
-
U.S. data continues to come in strong.
-
Corporate earnings are solid and we haven’t seen all of the effects of tax reform yet.
-
Over a trillion dollars will be repatriated back to the U.S.
-
The long-term technical market trend is healthy.
Anyone telling me to sell stocks because we see an increase in interest rates with the backdrop that was just laid out in place, is not looking at all of the data. It’s a horrible idea.

No matter what opinion an investor has now about the stock market’s future, they should be formulating their outlook because of a plan, a plan that contains certain rules. Rules that eliminate emotion. Trust me, emotion causes the largest upset of any plan and then inflicts more emotion on an investor. The aftermath of the first emotional outburst that initiates a premature decision with your portfolio is usually equally devastating.
Rules based approaches remove the emotions from these types of decisions, and eliminate the need to play guessing games, or obsess over what is taking place around them at the moment of stress. The last part of that sentence is key. It is because at that moment of stress, we all need to be grounded by a strategy.
For those that don’t have any system to rely on, the situation is far worse in times of anxiety. Investors that are serious about managing their money need to implement a plan before they do anything else. Take the time while the market has calmed down, so you don’t go into the next episode searching for answers in a panic.

Right now an investor should not fear the recent corrective activity, and they should also not get overwhelmed and overconfident by the quick snap back we have witnessed. The churning activity in the market is quite normal, and depending on the individual’s situation it might be a time to do nothing. Perhaps remaining steady and concluding that it’s not the time to add a ton of risk here is the way to go.
That should not be taken as an alarm for caution. It is prudent money management. Remember if one has been riding this bull market trend now for the better part of at least 4 years, they remain in the pilots seat. A passive investor should have little stress now, and simply continue to ride this bull market trend. A more active investor can take a period like this and play take what the market gives you. Solid fundamentally based companies get sold off, presenting either a quick opportunity or a good long term prospect.
Tweaking portfolios, adding select stocks, and remaining steadfast in the growth theme remains the way to approach this market. The bull market is in pause mode. As always we monitor the issues that roil the short term traders, but avoid premature conclusions.
Hedging, calling for tops, raising a lot of cash is a strategy for another day. The secular bull market trend remains in force and until that trend changes, there is no major change of strategy. Stay the course.
 to all of the readers that contribute to this forum to make these articles a better experience for everyone.
Best of Luck to All!
Disclaimer: This article contain my views of the equity market and what positioning is comfortable for me. Of course, it is not suited for everyone, there are far too many variables. Hopefully it sparks ideas, adds some common sense to the intricate investing process, and makes investors feel more calm, putting them in control. The opinions rendered here, are just that — opinions — and along with positions can change at any time. As always, I encourage readers to use common sense when it comes to managing any ideas that I decide to share with the community. Nowhere is it implied that any stock should be bought and put away until you die. Periodic reviews are mandatory to adjust to changes in the macro backdrop that will take place over time.
The Savvy Investor Marketplace service is off to a positive start. While the indices churn, all portfolios are outpacing the indices in the last month. Time to pick up the bargains that have been laid at our doorstep. A perfect time to reevaluate portfolios and get positioned with stocks that are poised for further gains. Consider a subscription to one of the most informative services available.
Disclosure: I am/we are long CSCO,MRK.
I wrote this article myself, and it expresses my own opinions. I am not receiving compensation for it (other than from Seeking Alpha). I have no business relationship with any company whose stock is mentioned in this article.
Be the first to comment